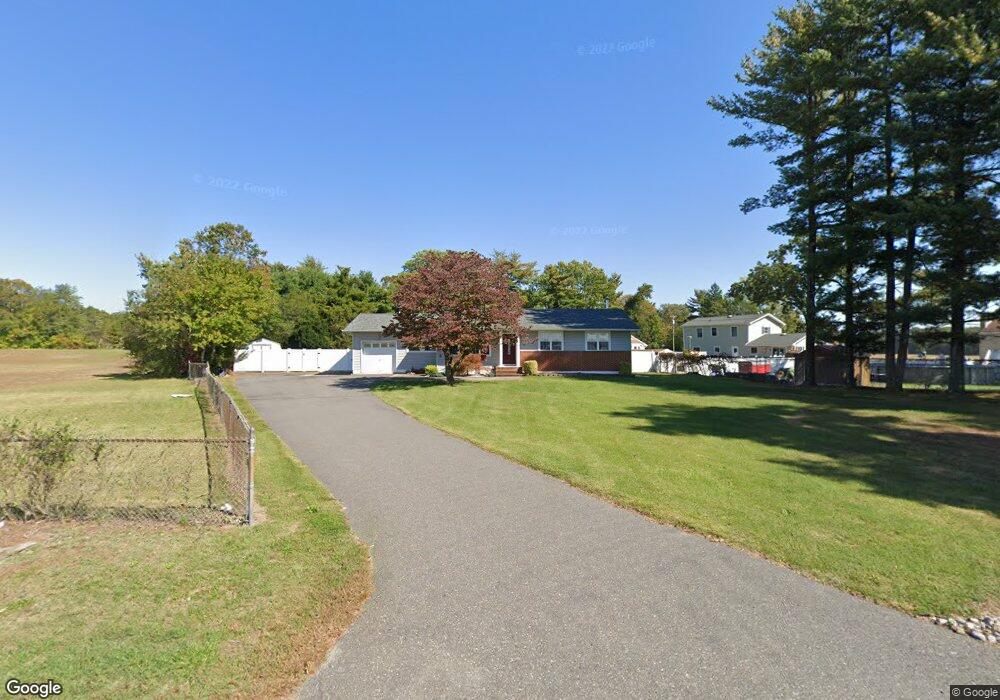
275 S Chew Rd Hammonton, NJ 08037
Estimated Value: $323,000 - $404,000
3
Beds
1
Bath
1,316
Sq Ft
$281/Sq Ft
Est. Value
About This Home
This home is located at 275 S Chew Rd, Hammonton, NJ 08037 and is currently estimated at $369,489, approximately $280 per square foot. 275 S Chew Rd is a home located in Atlantic County with nearby schools including Hammonton Early Childhood Education Center, Warren E. Sooy Jr. Elementary School, and Hammonton Middle School.
Ownership History
Date
Name
Owned For
Owner Type
Purchase Details
Closed on
Jan 29, 2003
Sold by
Bareis Dale
Bought by
Caruso Hans and Caruso Elizabeth
Current Estimated Value
Home Financials for this Owner
Home Financials are based on the most recent Mortgage that was taken out on this home.
Original Mortgage
$93,840
Outstanding Balance
$40,306
Interest Rate
5.99%
Mortgage Type
Purchase Money Mortgage
Estimated Equity
$329,183
Purchase Details
Closed on
Jun 12, 1991
Sold by
Caruso Herbert
Bought by
Caruso Susan
Create a Home Valuation Report for This Property
The Home Valuation Report is an in-depth analysis detailing your home's value as well as a comparison with similar homes in the area
Home Values in the Area
Average Home Value in this Area
Purchase History
| Date | Buyer | Sale Price | Title Company |
|---|---|---|---|
| Caruso Hans | $117,300 | -- | |
| Caruso Hans C | $117,300 | First American Title Ins Co | |
| Caruso Susan | $42,500 | -- |
Source: Public Records
Mortgage History
| Date | Status | Borrower | Loan Amount |
|---|---|---|---|
| Open | Caruso Hans C | $93,840 | |
| Closed | Caruso Hans | $93,840 |
Source: Public Records
Tax History Compared to Growth
Tax History
| Year | Tax Paid | Tax Assessment Tax Assessment Total Assessment is a certain percentage of the fair market value that is determined by local assessors to be the total taxable value of land and additions on the property. | Land | Improvement |
|---|---|---|---|---|
| 2025 | $5,752 | $209,000 | $57,800 | $151,200 |
| 2024 | $5,752 | $209,000 | $57,800 | $151,200 |
| 2023 | $5,691 | $209,000 | $57,800 | $151,200 |
| 2022 | $5,691 | $209,000 | $57,800 | $151,200 |
| 2021 | $5,712 | $209,000 | $57,800 | $151,200 |
| 2020 | $5,683 | $209,000 | $57,800 | $151,200 |
| 2019 | $5,662 | $209,000 | $57,800 | $151,200 |
| 2018 | $5,176 | $192,000 | $57,800 | $134,200 |
| 2017 | $5,103 | $192,000 | $57,800 | $134,200 |
| 2016 | $4,917 | $192,000 | $57,800 | $134,200 |
| 2015 | $4,773 | $192,000 | $57,800 | $134,200 |
| 2014 | $4,440 | $119,700 | $31,900 | $87,800 |
Source: Public Records
Map
Nearby Homes