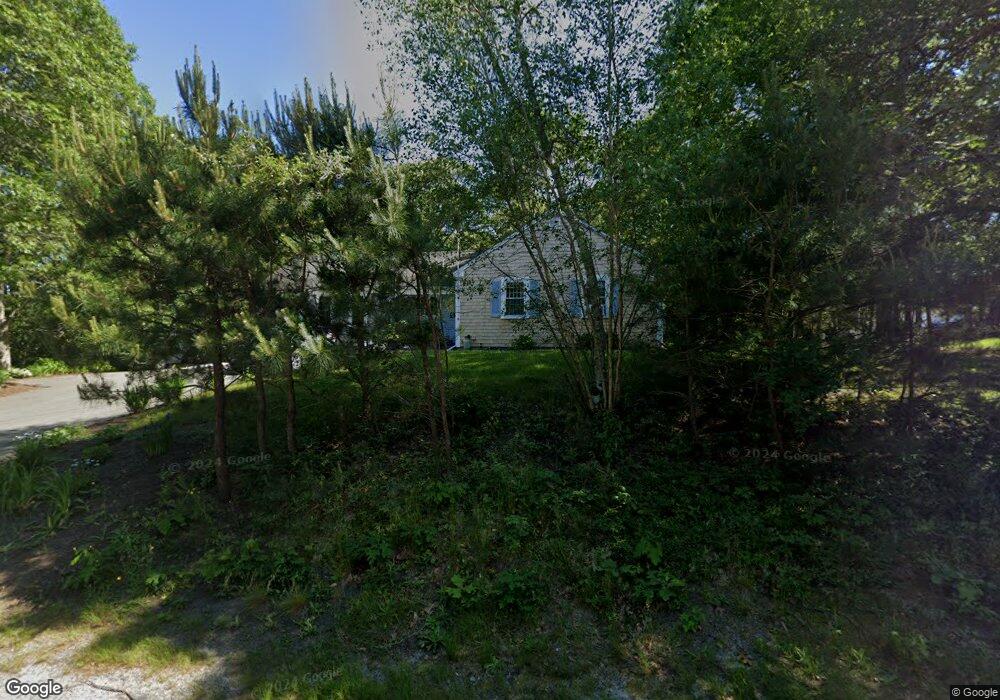
275 Setucket Rd Yarmouth Port, MA 02675
Yarmouth Port NeighborhoodEstimated Value: $706,000 - $786,000
3
Beds
2
Baths
1,144
Sq Ft
$655/Sq Ft
Est. Value
About This Home
This home is located at 275 Setucket Rd, Yarmouth Port, MA 02675 and is currently estimated at $749,224, approximately $654 per square foot. 275 Setucket Rd is a home located in Barnstable County with nearby schools including Dennis-Yarmouth Regional High School and St. Pius X. School.
Ownership History
Date
Name
Owned For
Owner Type
Purchase Details
Closed on
Jun 27, 2008
Sold by
Cuddy Doreen F and Cuddy James A
Bought by
Bernard Douglas J and Bernard Marilyn
Current Estimated Value
Home Financials for this Owner
Home Financials are based on the most recent Mortgage that was taken out on this home.
Original Mortgage
$252,800
Outstanding Balance
$163,089
Interest Rate
6.07%
Mortgage Type
Purchase Money Mortgage
Estimated Equity
$586,135
Purchase Details
Closed on
May 30, 1997
Sold by
Nelson Joann M and Nelson Norman A
Bought by
Cuddy Dorenn F and Cuddy James A
Home Financials for this Owner
Home Financials are based on the most recent Mortgage that was taken out on this home.
Original Mortgage
$106,850
Interest Rate
8.09%
Mortgage Type
Purchase Money Mortgage
Create a Home Valuation Report for This Property
The Home Valuation Report is an in-depth analysis detailing your home's value as well as a comparison with similar homes in the area
Home Values in the Area
Average Home Value in this Area
Purchase History
| Date | Buyer | Sale Price | Title Company |
|---|---|---|---|
| Bernard Douglas J | $316,000 | -- | |
| Cuddy Dorenn F | $112,500 | -- |
Source: Public Records
Mortgage History
| Date | Status | Borrower | Loan Amount |
|---|---|---|---|
| Open | Bernard Douglas J | $252,800 | |
| Previous Owner | Cuddy Dorenn F | $106,850 |
Source: Public Records
Tax History Compared to Growth
Tax History
| Year | Tax Paid | Tax Assessment Tax Assessment Total Assessment is a certain percentage of the fair market value that is determined by local assessors to be the total taxable value of land and additions on the property. | Land | Improvement |
|---|---|---|---|---|
| 2025 | $4,814 | $680,000 | $202,900 | $477,100 |
| 2024 | $4,536 | $614,600 | $176,300 | $438,300 |
| 2023 | $4,374 | $539,300 | $153,400 | $385,900 |
| 2022 | $4,163 | $453,500 | $146,400 | $307,100 |
| 2021 | $3,887 | $406,600 | $146,400 | $260,200 |
| 2020 | $3,871 | $387,100 | $155,000 | $232,100 |
| 2019 | $3,569 | $353,400 | $155,000 | $198,400 |
| 2018 | $3,064 | $297,800 | $129,200 | $168,600 |
| 2017 | $2,954 | $294,800 | $129,200 | $165,600 |
| 2016 | $2,838 | $284,400 | $118,800 | $165,600 |
| 2015 | $2,655 | $264,400 | $113,700 | $150,700 |
Source: Public Records
Map
Nearby Homes
- 13 Covey Dr
- 4 Ebb Rd
- 153 Bayridge Dr
- 11 Uncle Stanleys Way
- 111 Merchant Ave
- 26 Olivia Walker Way
- 6 Nimble Hill Dr
- 15 Captain Jud Rd
- 118 Driftwood Ln
- 59 Main St Unit 19-2
- 59 Route 6a Unit 29-4
- 129 Driftwood Ln
- 17 Margate Ln
- 268 Main St
- 44 Stratford Ln
- 17 Fairmount Rd
- 51 Bray Farm Rd N
- 17 Fairmount Rd
- 4 Old Colony Way
- 32 Captain Walsh Dr