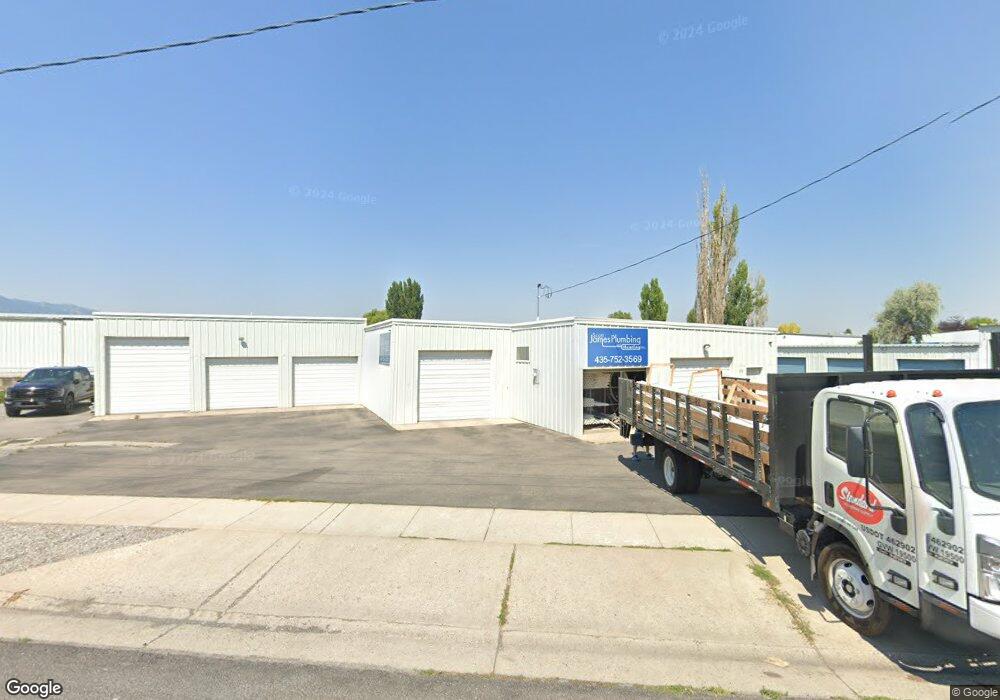
275 Southwest St Logan, UT 84321
Woodruff NeighborhoodEstimated Value: $462,000
--
Bed
--
Bath
3,634
Sq Ft
$127/Sq Ft
Est. Value
About This Home
This home is located at 275 Southwest St, Logan, UT 84321 and is currently estimated at $462,000, approximately $127 per square foot. 275 Southwest St is a home located in Cache County with nearby schools including Woodruff School, Mount Logan Middle School, and Logan High School.
Ownership History
Date
Name
Owned For
Owner Type
Purchase Details
Closed on
Aug 28, 2023
Sold by
Scott James and Scott Tammy James
Bought by
Stat Rentals Llc
Current Estimated Value
Purchase Details
Closed on
Sep 14, 2010
Sold by
Weston Bart T and Oman Joyce W
Bought by
James Scott and James Tammy
Purchase Details
Closed on
Dec 31, 2008
Sold by
Weston Samuel R
Bought by
Todd G Weston Family Limited Partnership
Create a Home Valuation Report for This Property
The Home Valuation Report is an in-depth analysis detailing your home's value as well as a comparison with similar homes in the area
Home Values in the Area
Average Home Value in this Area
Purchase History
| Date | Buyer | Sale Price | Title Company |
|---|---|---|---|
| Stat Rentals Llc | -- | None Listed On Document | |
| Stat Rentals Llc | -- | None Listed On Document | |
| James Scott | -- | Hickman Land Title Company | |
| Weston Bart T | -- | Hickman Land Title Company | |
| Todd G Weston Family Limited Partnership | -- | Accommodation |
Source: Public Records
Tax History Compared to Growth
Tax History
| Year | Tax Paid | Tax Assessment Tax Assessment Total Assessment is a certain percentage of the fair market value that is determined by local assessors to be the total taxable value of land and additions on the property. | Land | Improvement |
|---|---|---|---|---|
| 2025 | $3,346 | $432,712 | $315,810 | $116,902 |
| 2024 | $2,165 | $271,162 | $104,454 | $166,708 |
| 2023 | $2,094 | $250,050 | $99,480 | $150,570 |
| 2022 | $1,917 | $213,730 | $63,160 | $150,570 |
| 2021 | $2,180 | $206,560 | $63,160 | $143,400 |
| 2020 | $2,423 | $206,560 | $63,160 | $143,400 |
| 2019 | $2,295 | $187,260 | $63,160 | $124,100 |
| 2018 | $2,514 | $187,260 | $63,160 | $124,100 |
| 2017 | $2,375 | $170,060 | $0 | $0 |
| 2016 | $2,462 | $170,060 | $0 | $0 |
| 2015 | $2,465 | $170,060 | $0 | $0 |
| 2014 | $2,228 | $170,060 | $0 | $0 |
| 2013 | -- | $170,060 | $0 | $0 |
Source: Public Records
Map
Nearby Homes