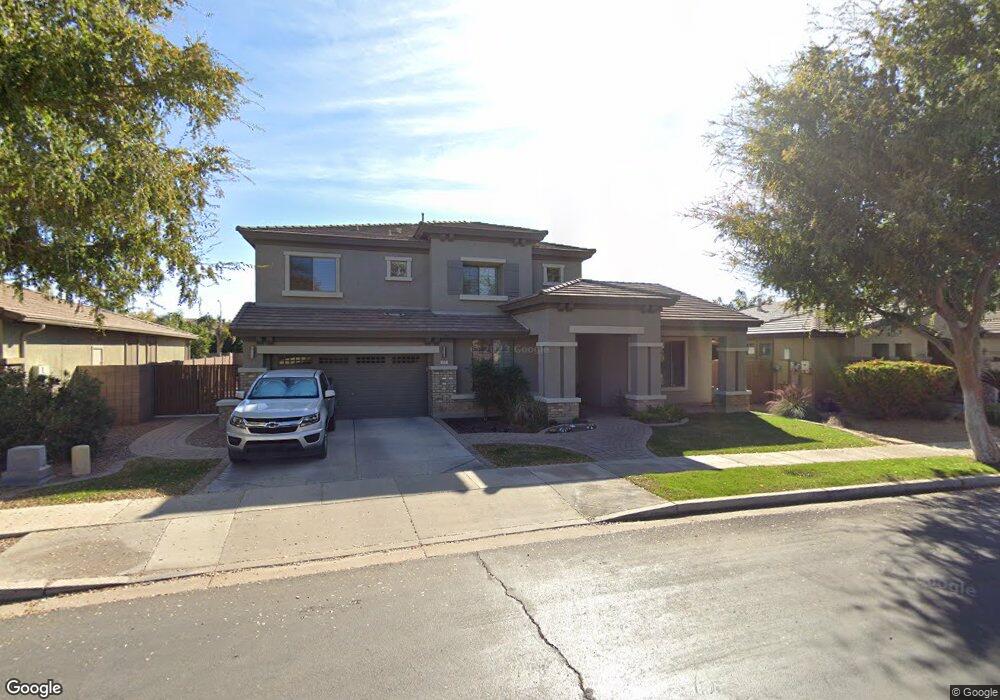
275 W Seagull Place Chandler, AZ 85286
Central Chandler NeighborhoodEstimated Value: $711,655 - $843,000
--
Bed
3
Baths
3,087
Sq Ft
$258/Sq Ft
Est. Value
About This Home
This home is located at 275 W Seagull Place, Chandler, AZ 85286 and is currently estimated at $796,414, approximately $257 per square foot. 275 W Seagull Place is a home located in Maricopa County with nearby schools including T. Dale Hancock Elementary School, Bogle Junior High School, and Hamilton High School.
Ownership History
Date
Name
Owned For
Owner Type
Purchase Details
Closed on
Nov 9, 2012
Sold by
Swanson Todd A and Swanson Julie A
Bought by
Swanson Todd A and Swanson Julie
Current Estimated Value
Home Financials for this Owner
Home Financials are based on the most recent Mortgage that was taken out on this home.
Original Mortgage
$137,000
Outstanding Balance
$24,263
Interest Rate
3.34%
Mortgage Type
New Conventional
Estimated Equity
$772,151
Purchase Details
Closed on
Nov 12, 2009
Sold by
Swanson Todd A and Swanson Julie A
Bought by
Swanson Todd A and Swanson Julie
Purchase Details
Closed on
Jan 16, 2003
Sold by
Fulton Homes Sales Corp
Bought by
Swanson Todd A and Swanson Julie A
Home Financials for this Owner
Home Financials are based on the most recent Mortgage that was taken out on this home.
Original Mortgage
$226,600
Interest Rate
5.96%
Mortgage Type
New Conventional
Create a Home Valuation Report for This Property
The Home Valuation Report is an in-depth analysis detailing your home's value as well as a comparison with similar homes in the area
Home Values in the Area
Average Home Value in this Area
Purchase History
| Date | Buyer | Sale Price | Title Company |
|---|---|---|---|
| Swanson Todd A | -- | Accommodation | |
| Swanson Todd A | -- | Accommodation | |
| Swanson Todd A | -- | None Available | |
| Swanson Todd A | $271,016 | Security Title Agency | |
| Fulton Homes Sales Corp | $217,412 | Security Title Agency |
Source: Public Records
Mortgage History
| Date | Status | Borrower | Loan Amount |
|---|---|---|---|
| Open | Swanson Todd A | $137,000 | |
| Closed | Swanson Todd A | $226,600 |
Source: Public Records
Tax History Compared to Growth
Tax History
| Year | Tax Paid | Tax Assessment Tax Assessment Total Assessment is a certain percentage of the fair market value that is determined by local assessors to be the total taxable value of land and additions on the property. | Land | Improvement |
|---|---|---|---|---|
| 2025 | $3,408 | $42,861 | -- | -- |
| 2024 | $3,268 | $40,820 | -- | -- |
| 2023 | $3,268 | $55,050 | $11,010 | $44,040 |
| 2022 | $3,146 | $39,700 | $7,940 | $31,760 |
| 2021 | $3,261 | $38,350 | $7,670 | $30,680 |
| 2020 | $3,247 | $36,270 | $7,250 | $29,020 |
| 2019 | $3,122 | $34,920 | $6,980 | $27,940 |
| 2018 | $3,024 | $33,410 | $6,680 | $26,730 |
| 2017 | $2,818 | $31,770 | $6,350 | $25,420 |
| 2016 | $2,715 | $33,880 | $6,770 | $27,110 |
| 2015 | $2,631 | $31,970 | $6,390 | $25,580 |
Source: Public Records
Map
Nearby Homes
- 251 W Flamingo Dr
- 2333 S Eileen Place
- 1981 S Tumbleweed Ln Unit 3
- 1981 S Tumbleweed Ln Unit 5
- 1981 S Tumbleweed Ln Unit 4
- 1981 S Tumbleweed Ln Unit 2
- 1981 S Tumbleweed Ln Unit 1
- 564 W Thompson Place
- 202 W Raven Dr
- 1687 S Vine St
- 634 W Goldfinch Way
- 821 W Oriole Way
- 180 W Roadrunner Dr
- 271 W Roadrunner Dr
- 2861 S Illinois Place
- 633 W Canary Way
- 1513 S 108th Way
- 1650 S Arizona Ave Unit 173
- 1650 S Arizona Ave Unit 164
- 1650 S Arizona Ave Unit 80
- 265 W Seagull Place
- 285 W Seagull Place
- 276 W Swan Dr
- 266 W Swan Dr
- 286 W Swan Dr
- 295 W Seagull Place
- 274 W Seagull Place
- 256 W Swan Dr
- 296 W Swan Dr
- 264 W Seagull Place
- 305 W Seagull Place
- 245 W Seagull Place
- 294 W Seagull Place
- 246 W Swan Dr
- 306 W Swan Dr
- 254 W Seagull Place
- 304 W Seagull Place
- 315 W Seagull Place
- 225 W Seagull Place
- 277 W Swan Dr