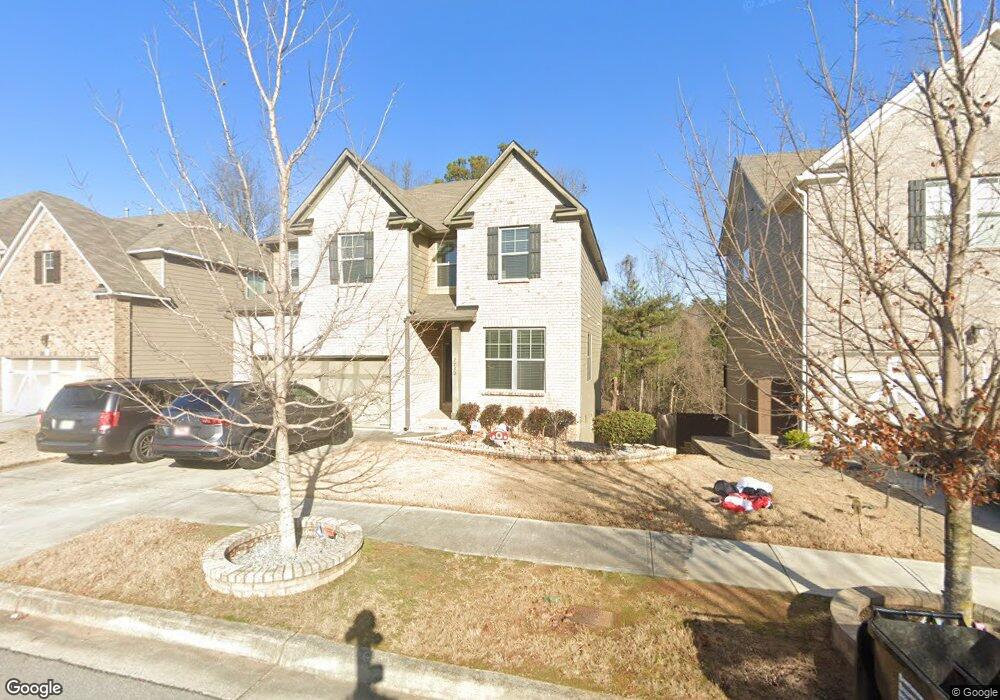
2750 Blake Towers Ln Unit 45 Buford, GA 30519
Estimated Value: $483,934 - $549,000
4
Beds
3
Baths
2,568
Sq Ft
$202/Sq Ft
Est. Value
About This Home
This home is located at 2750 Blake Towers Ln Unit 45, Buford, GA 30519 and is currently estimated at $519,484, approximately $202 per square foot. 2750 Blake Towers Ln Unit 45 is a home located in Gwinnett County with nearby schools including Harmony Elementary School and Glenn C. Jones Middle School.
Ownership History
Date
Name
Owned For
Owner Type
Purchase Details
Closed on
Jun 18, 2020
Sold by
Sph Property One Llc
Bought by
Park Chan Woo and Na Hyegyung
Current Estimated Value
Home Financials for this Owner
Home Financials are based on the most recent Mortgage that was taken out on this home.
Original Mortgage
$243,200
Outstanding Balance
$214,623
Interest Rate
3.2%
Mortgage Type
New Conventional
Estimated Equity
$304,861
Purchase Details
Closed on
Jan 30, 2020
Sold by
Vales Chas D
Bought by
Sph Property One Llc
Purchase Details
Closed on
Dec 28, 2018
Sold by
Walters Genie Marie
Bought by
Walters Dana L
Purchase Details
Closed on
Dec 27, 2018
Sold by
Walters Dana L
Bought by
Walters Genie Marie
Purchase Details
Closed on
May 17, 2016
Sold by
Wilson Parker Homes Of Thompson Crossing
Bought by
Walters Dana L and Vales Chas D
Home Financials for this Owner
Home Financials are based on the most recent Mortgage that was taken out on this home.
Original Mortgage
$274,977
Interest Rate
3.75%
Mortgage Type
FHA
Create a Home Valuation Report for This Property
The Home Valuation Report is an in-depth analysis detailing your home's value as well as a comparison with similar homes in the area
Home Values in the Area
Average Home Value in this Area
Purchase History
| Date | Buyer | Sale Price | Title Company |
|---|---|---|---|
| Park Chan Woo | $304,000 | -- | |
| Sph Property One Llc | $290,575 | -- | |
| Walters Dana L | -- | -- | |
| Walters Genie Marie | -- | -- | |
| Walters Dana L | $280,100 | -- |
Source: Public Records
Mortgage History
| Date | Status | Borrower | Loan Amount |
|---|---|---|---|
| Open | Park Chan Woo | $243,200 | |
| Previous Owner | Walters Dana L | $274,977 |
Source: Public Records
Tax History Compared to Growth
Tax History
| Year | Tax Paid | Tax Assessment Tax Assessment Total Assessment is a certain percentage of the fair market value that is determined by local assessors to be the total taxable value of land and additions on the property. | Land | Improvement |
|---|---|---|---|---|
| 2025 | $6,299 | $212,760 | $40,000 | $172,760 |
| 2024 | $5,894 | $185,680 | $41,600 | $144,080 |
| 2023 | $5,894 | $185,680 | $41,600 | $144,080 |
| 2022 | $5,604 | $173,160 | $35,200 | $137,960 |
| 2021 | $4,465 | $121,600 | $26,880 | $94,720 |
| 2020 | $5,024 | $130,080 | $26,880 | $103,200 |
| 2019 | $4,367 | $116,600 | $25,360 | $91,240 |
| 2018 | $4,088 | $116,600 | $25,360 | $91,240 |
| 2016 | $751 | $14,000 | $14,000 | $0 |
| 2015 | $527 | $14,000 | $14,000 | $0 |
Source: Public Records
Map
Nearby Homes
- 2740 Blake Towers Ln
- 2910 Blake Towers Ln
- 2930 Blake Towers Ln
- 2307 Loughridge Dr
- 4298 Friar Tuck Ln
- 2938 Pebblebrook Dr
- 4375 Easter Lily Ave
- 3026 Sea Aster Way
- 3016 Sea Aster Way
- 2678 N Bogan Rd
- 3340 Ivey Ridge Rd NE
- 2997 Spring Lake Dr
- 2997 Springlake Dr
- 4238 Hamilton Mill Rd
- 3236 Copper Creek Ln NE
- 3271 Meadow Lily Ct
- 4679 Silver Meadow Dr
- 3964 Hamilton Mill Rd
- 2750 Blake Towers Ln
- 2740 Blake Towers Ln Unit 46
- 2760 Blake Towers Ln Unit 44
- 2760 Blake Towers Ln
- 2730 Blake Towers Ln Unit 47
- 2730 Blake Towers Ln
- 2546 Loughridge Dr Unit 55
- 2546 Loughridge Dr
- 2731 Blake Towers Ln
- 2770 Blake Towers Ln Unit 43
- 2720 Blake Towers Ln
- 2526 Loughridge Dr
- 2711 Blake Towers Ln
- 2780 Blake Towers Ln Unit 42
- 2557 Loughridge Dr
- 2557 Loughridge Dr Unit 129
- 2557 Loughridge Dr Unit 42
- 2710 Blake Towers Ln
- 2516 Loughridge Dr Unit 57
- 2516 Loughridge Dr