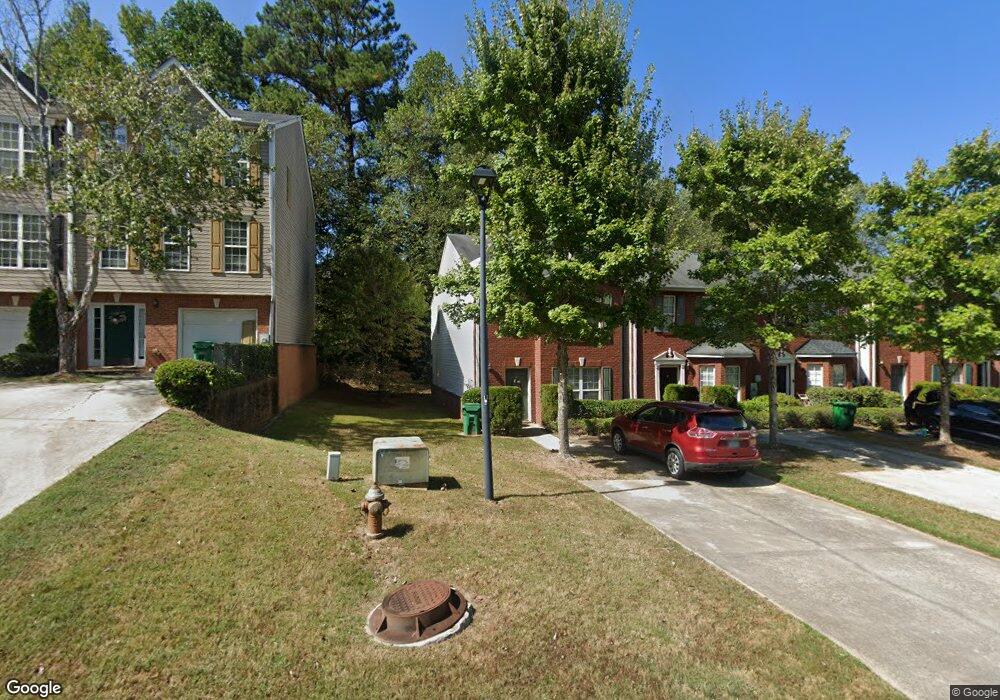
2750 Norfair Loop Unit 2 Lithonia, GA 30038
Estimated Value: $162,765 - $165,000
3
Beds
3
Baths
1,468
Sq Ft
$112/Sq Ft
Est. Value
About This Home
This home is located at 2750 Norfair Loop Unit 2, Lithonia, GA 30038 and is currently estimated at $164,441, approximately $112 per square foot. 2750 Norfair Loop Unit 2 is a home located in DeKalb County with nearby schools including Fairington Elementary School, Salem Middle School, and Martin Luther King- Jr. High School.
Ownership History
Date
Name
Owned For
Owner Type
Purchase Details
Closed on
Jan 23, 2015
Sold by
Beryl Investor Svcs Inc
Bought by
Havenfold Properties Llc
Current Estimated Value
Purchase Details
Closed on
Apr 19, 2012
Sold by
Xiao Bing
Bought by
Beryl Investor Svcs Inc
Purchase Details
Closed on
May 31, 2011
Sold by
Hud-Housing Of Urban Dev
Bought by
Xiao Big
Purchase Details
Closed on
Oct 5, 2010
Sold by
Citimortgage Inc
Bought by
Hud-Housing Of Urban Dev
Purchase Details
Closed on
Aug 15, 2003
Sold by
Eastland Homes Inc
Bought by
Brown Lamont E
Home Financials for this Owner
Home Financials are based on the most recent Mortgage that was taken out on this home.
Original Mortgage
$106,823
Interest Rate
5.75%
Mortgage Type
New Conventional
Create a Home Valuation Report for This Property
The Home Valuation Report is an in-depth analysis detailing your home's value as well as a comparison with similar homes in the area
Home Values in the Area
Average Home Value in this Area
Purchase History
| Date | Buyer | Sale Price | Title Company |
|---|---|---|---|
| Havenfold Properties Llc | $58,000 | -- | |
| Beryl Investor Svcs Inc | -- | -- | |
| Xiao Big | -- | -- | |
| Hud-Housing Of Urban Dev | -- | -- | |
| Citimortgage Inc | $107,201 | -- | |
| Brown Lamont E | $108,500 | -- |
Source: Public Records
Mortgage History
| Date | Status | Borrower | Loan Amount |
|---|---|---|---|
| Previous Owner | Brown Lamont E | $106,823 |
Source: Public Records
Tax History
| Year | Tax Paid | Tax Assessment Tax Assessment Total Assessment is a certain percentage of the fair market value that is determined by local assessors to be the total taxable value of land and additions on the property. | Land | Improvement |
|---|---|---|---|---|
| 2025 | $3,648 | $72,040 | $10,086 | $61,954 |
| 2024 | $3,621 | $72,040 | $10,000 | $62,040 |
| 2023 | $3,621 | $73,240 | $10,000 | $63,240 |
Source: Public Records
Map
Nearby Homes
- 2722 Norfair Loop
- 2700 Norfair Loop
- 3204 Fairington Village Dr
- 1202 Fairington Village Dr
- 6101 Fairington Village Dr Unit 6101
- 7302 Fairington Village Dr
- 8304 Fairington Village Dr
- 6301 Fairington Ridge Cir
- 9 Willowick Dr
- 6203 Fairington Ridge Cir
- 7101 Fairington Ridge Cir
- 77 Willowick Dr
- 8104 Fairington Ridge Cir
- 12301 Fairington Ridge Cir
- 2 Willowick Dr
- 10204 Fairington Ridge Cir Unit 10204
- 13202 Fairington Ridge Cir
- 14104 Fairington Ridge Cir
- 13304 Fairington Ridge Cir Unit L4
- 13104 Fairington Ridge Cir
- 2752 Norfair Loop
- 2754 Norfair Loop
- 2754 Norfair Loop
- 2748 Norfair Loop
- 2746 Norfair Loop
- 2756 Norfair Loop
- 2756 Norfair Loop Unit 2
- 2744 Norfair Loop
- 2758 Norfair Loop
- 2742 Norfair Loop
- 2760 Norfair Loop
- 2740 Norfair Loop
- 2762 Norfair Loop Unit 2760
- 2762 Norfair Loop
- 2738 Norfair Loop
- 2764 Norfair Loop Unit 2
- 2749 Norfair Loop
- 2747 Norfair Loop
- 2747 Norfair Loop
Your Personal Tour Guide
Ask me questions while you tour the home.