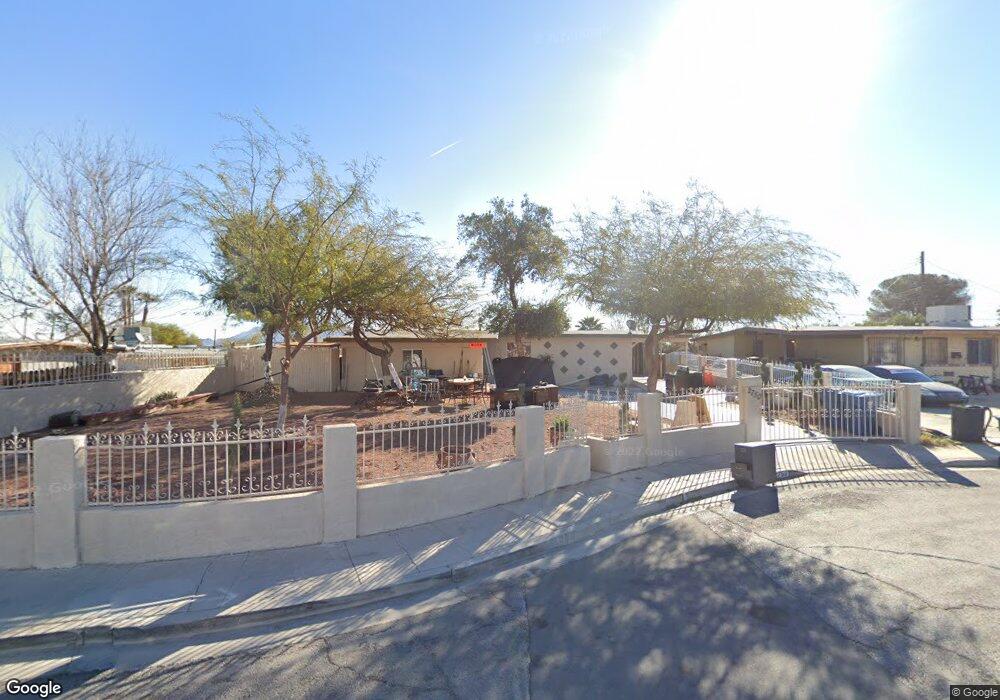
2750 Talbot St Las Vegas, NV 89169
Estimated Value: $334,000 - $410,000
3
Beds
2
Baths
1,161
Sq Ft
$311/Sq Ft
Est. Value
About This Home
This home is located at 2750 Talbot St, Las Vegas, NV 89169 and is currently estimated at $361,397, approximately $311 per square foot. 2750 Talbot St is a home located in Clark County with nearby schools including Robert E Lake Elementary School, Knudson Academy of the Arts, and Valley High School.
Ownership History
Date
Name
Owned For
Owner Type
Purchase Details
Closed on
Feb 18, 2011
Sold by
Port Cypress Holdings Llc
Bought by
Ramirez Samuel and Ramirez Cora C
Current Estimated Value
Home Financials for this Owner
Home Financials are based on the most recent Mortgage that was taken out on this home.
Original Mortgage
$88,369
Outstanding Balance
$61,800
Interest Rate
5.25%
Mortgage Type
FHA
Estimated Equity
$299,597
Purchase Details
Closed on
Sep 10, 2010
Sold by
Lyon Yvonne
Bought by
Port Cypress Holdings Llc
Purchase Details
Closed on
Dec 30, 2003
Sold by
Household Finance Realty Corp
Bought by
Lyon Yvonne
Home Financials for this Owner
Home Financials are based on the most recent Mortgage that was taken out on this home.
Original Mortgage
$118,750
Interest Rate
7.85%
Mortgage Type
Unknown
Purchase Details
Closed on
Jul 23, 2003
Sold by
Alfazak Norma
Bought by
Household Finance Realty Corp Of Nevada
Create a Home Valuation Report for This Property
The Home Valuation Report is an in-depth analysis detailing your home's value as well as a comparison with similar homes in the area
Home Values in the Area
Average Home Value in this Area
Purchase History
| Date | Buyer | Sale Price | Title Company |
|---|---|---|---|
| Ramirez Samuel | $90,000 | Fidelity National Title | |
| Port Cypress Holdings Llc | $45,500 | Fidelity National Title T | |
| Lyon Yvonne | $125,000 | Lawyers Title Of Nevada | |
| Household Finance Realty Corp Of Nevada | $106,636 | Lawyers Title Of Nevada |
Source: Public Records
Mortgage History
| Date | Status | Borrower | Loan Amount |
|---|---|---|---|
| Open | Ramirez Samuel | $88,369 | |
| Previous Owner | Lyon Yvonne | $118,750 |
Source: Public Records
Tax History Compared to Growth
Tax History
| Year | Tax Paid | Tax Assessment Tax Assessment Total Assessment is a certain percentage of the fair market value that is determined by local assessors to be the total taxable value of land and additions on the property. | Land | Improvement |
|---|---|---|---|---|
| 2025 | $1,185 | $50,573 | $28,000 | $22,573 |
| 2024 | $1,113 | $50,573 | $28,000 | $22,573 |
| 2023 | $1,113 | $53,483 | $33,250 | $20,233 |
| 2022 | $1,034 | $46,272 | $28,000 | $18,272 |
| 2021 | $685 | $41,081 | $24,150 | $16,931 |
| 2020 | $634 | $40,601 | $24,150 | $16,451 |
| 2019 | $594 | $35,473 | $19,600 | $15,873 |
| 2018 | $567 | $32,124 | $17,150 | $14,974 |
| 2017 | $888 | $30,281 | $15,400 | $14,881 |
| 2016 | $806 | $23,431 | $9,100 | $14,331 |
| 2015 | $1,416 | $23,017 | $9,100 | $13,917 |
| 2014 | $514 | $16,999 | $6,300 | $10,699 |
Source: Public Records
Map
Nearby Homes
- 2749 Del Mar Place
- 2773 Talbot St
- 2080 Karen Ave Unit 68
- 2080 Karen Ave Unit 1
- 2080 Karen Ave Unit 76
- 2080 Karen Ave Unit B49
- 2080 Karen Ave Unit 94
- 2824 El Toreador St
- 2825 Burnham Ave
- 1628 Izabella Ave
- 1564 Vegas Valley Dr
- 1914 Capistrano Ave
- 1659 Palma Vista Ave
- 2944 Burnham Ave
- 1724 Palora Ave
- 1613 Capistrano Ave
- 1440 Vegas Valley Dr Unit 3
- 1440 Vegas Valley Dr Unit 2
- 1440 Vegas Valley Dr Unit 1
- 1440 Vegas Valley Dr Unit 6
- 2758 Talbot St
- 1861 Del Mar Ave
- 1843 Del Mar Ave
- 1877 Del Mar Ave
- 2743 Del Mar Place
- 1866 Balboa Ave
- 1848 Balboa Ave
- 1882 Balboa Ave
- 2735 Del Mar Place
- 2753 Talbot St
- 2743 Talbot St
- 1898 Balboa Ave
- 2763 Talbot St
- 1856 Del Mar Ave
- 2733 Talbot St
- 1872 Del Mar Ave
- 1840 Del Mar Ave
- 1880 Del Mar Ave
- 1914 Balboa Ave
- 1822 Del Mar Ave