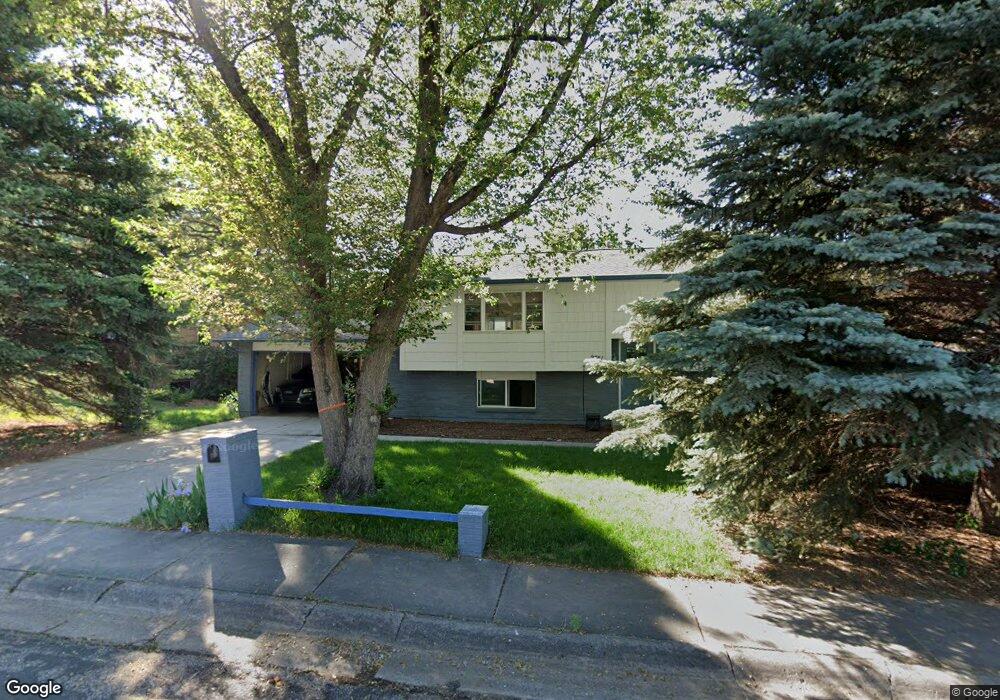
2751 Flintridge Cir Colorado Springs, CO 80918
Garden Ranch NeighborhoodEstimated Value: $411,000 - $434,000
4
Beds
3
Baths
1,110
Sq Ft
$380/Sq Ft
Est. Value
About This Home
This home is located at 2751 Flintridge Cir, Colorado Springs, CO 80918 and is currently estimated at $422,279, approximately $380 per square foot. 2751 Flintridge Cir is a home located in El Paso County with nearby schools including Grant Elementary School, Mann Middle School, and Mitchell High School.
Ownership History
Date
Name
Owned For
Owner Type
Purchase Details
Closed on
Jun 22, 2012
Sold by
Shafrin Jane
Bought by
Janoka Raymond T and Shoaff Rachel N
Current Estimated Value
Home Financials for this Owner
Home Financials are based on the most recent Mortgage that was taken out on this home.
Original Mortgage
$173,695
Outstanding Balance
$118,497
Interest Rate
3.5%
Mortgage Type
FHA
Estimated Equity
$303,782
Purchase Details
Closed on
Dec 2, 2010
Sold by
A Happy Home Llc
Bought by
Shafrin Jane
Purchase Details
Closed on
Jun 25, 2010
Sold by
Fannie Mae
Bought by
A Happy Home Llc
Purchase Details
Closed on
Feb 4, 2010
Sold by
Wheatley James M and Wheatley Lynetta J
Bought by
Federal National Mortgage Association
Purchase Details
Closed on
Sep 10, 2007
Sold by
Wheatley Lynetta J
Bought by
Mack Patti L
Purchase Details
Closed on
Oct 24, 2000
Sold by
Wheatley James M
Bought by
Wheatley James M and Wheatley Lynetta J
Purchase Details
Closed on
Mar 1, 1977
Bought by
Janoka Raymond T
Create a Home Valuation Report for This Property
The Home Valuation Report is an in-depth analysis detailing your home's value as well as a comparison with similar homes in the area
Home Values in the Area
Average Home Value in this Area
Purchase History
| Date | Buyer | Sale Price | Title Company |
|---|---|---|---|
| Janoka Raymond T | $176,900 | Cb Title | |
| Shafrin Jane | -- | None Available | |
| A Happy Home Llc | $125,000 | Cat | |
| Federal National Mortgage Association | -- | None Available | |
| Mack Patti L | -- | None Available | |
| Wheatley James M | -- | -- | |
| Janoka Raymond T | -- | -- |
Source: Public Records
Mortgage History
| Date | Status | Borrower | Loan Amount |
|---|---|---|---|
| Open | Janoka Raymond T | $173,695 |
Source: Public Records
Tax History Compared to Growth
Tax History
| Year | Tax Paid | Tax Assessment Tax Assessment Total Assessment is a certain percentage of the fair market value that is determined by local assessors to be the total taxable value of land and additions on the property. | Land | Improvement |
|---|---|---|---|---|
| 2025 | $1,518 | $32,700 | -- | -- |
| 2024 | $1,403 | $31,740 | $4,820 | $26,920 |
| 2023 | $1,403 | $31,740 | $4,820 | $26,920 |
| 2022 | $1,267 | $22,640 | $3,610 | $19,030 |
| 2021 | $1,374 | $23,290 | $3,720 | $19,570 |
| 2020 | $1,300 | $19,150 | $3,220 | $15,930 |
| 2019 | $1,293 | $19,150 | $3,220 | $15,930 |
| 2018 | $1,088 | $14,830 | $2,160 | $12,670 |
| 2017 | $1,031 | $14,830 | $2,160 | $12,670 |
| 2016 | $837 | $14,430 | $2,230 | $12,200 |
| 2015 | $833 | $14,430 | $2,230 | $12,200 |
| 2014 | $782 | $13,000 | $2,230 | $10,770 |
Source: Public Records
Map
Nearby Homes
- 2727 Flintridge Dr
- 4016 Goldenrod Dr
- 3010 Fireweed Dr
- 4140 Anitra Cir
- 4410 Moonlight Dr
- 4434 Misty Dr
- 3633 Indianpipe Cir
- 4506 Ridgecrest Dr
- 4454 Ranch Cir
- 4295 Ridgecrest Dr
- 3710 Windflower Cir
- 4518 Misty Dr
- 3704 Indianpipe Cir
- 3709 Anemone Cir
- 2832 Ridgeglen Way
- 3916 Coral Point
- 3680 E Wade Ln
- 3660 E Wade Ln
- 3716 Indianpipe Cir
- 3619 Queen Anne Way
- 2747 Flintridge Cir
- 2755 Flintridge Cir
- 2743 Flintridge Cir
- 2750 Flintridge Cir
- 2759 Flintridge Cir
- 2754 Flintridge Cir
- 2746 Flintridge Cir
- 2758 Flintridge Cir
- 2739 Flintridge Cir
- 2763 Flintridge Cir
- 2742 Flintridge Cir
- 2762 Flintridge Cir
- 2737 Flintridge Dr
- 2735 Flintridge Dr
- 2739 Flintridge Dr
- 2733 Flintridge Dr
- 2735 Flintridge Cir
- 2738 Flintridge Cir
- 2731 Flintridge Dr
- 2770 Flintridge Cir