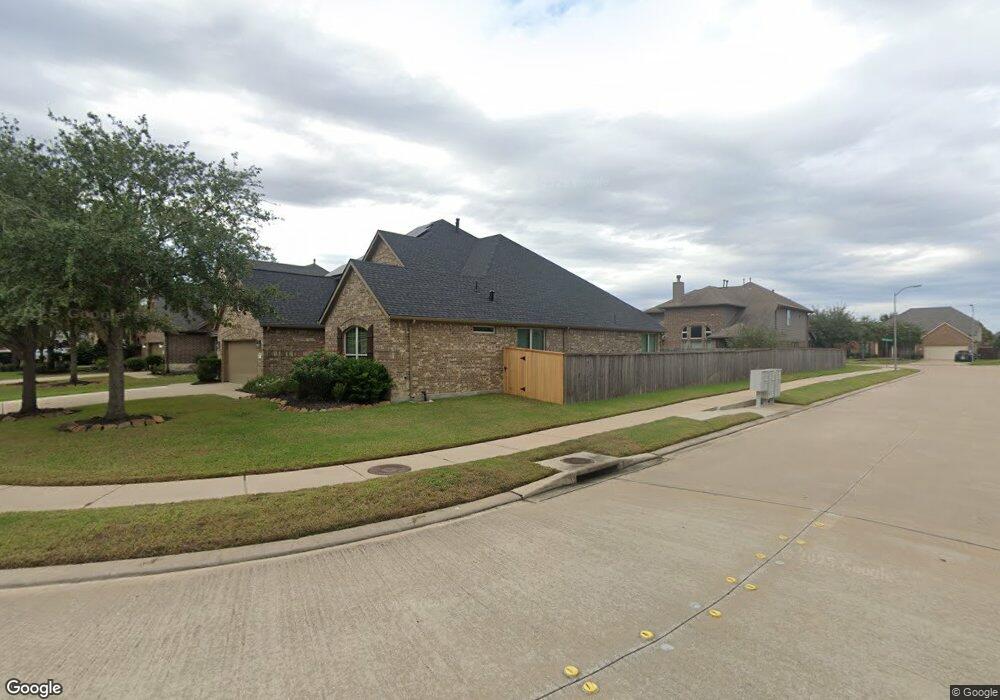
27510 Fleming Bluff Ct Fulshear, TX 77441
Estimated Value: $459,000 - $492,000
5
Beds
4
Baths
3,227
Sq Ft
$149/Sq Ft
Est. Value
About This Home
This home is located at 27510 Fleming Bluff Ct, Fulshear, TX 77441 and is currently estimated at $481,939, approximately $149 per square foot. 27510 Fleming Bluff Ct is a home located in Fort Bend County with nearby schools including Campbell Elementary School, Joe M. Adams Junior High, and Sugar Creek Montessori - Fulshear/West Katy.
Ownership History
Date
Name
Owned For
Owner Type
Purchase Details
Closed on
Apr 25, 2014
Sold by
Gibson Chad J and Gibson Lindsey S
Bought by
Cole Ronnie Adam and Cole Jaynce
Current Estimated Value
Home Financials for this Owner
Home Financials are based on the most recent Mortgage that was taken out on this home.
Original Mortgage
$315,000
Outstanding Balance
$239,639
Interest Rate
4.36%
Mortgage Type
VA
Estimated Equity
$242,300
Purchase Details
Closed on
Oct 29, 2013
Sold by
Beazer Homes Texas Lp
Bought by
Gibson Chad J and Gibson Lindsey S
Home Financials for this Owner
Home Financials are based on the most recent Mortgage that was taken out on this home.
Original Mortgage
$203,298
Interest Rate
4.26%
Mortgage Type
New Conventional
Purchase Details
Closed on
Mar 13, 2012
Sold by
Beazer Homes Texas Lp
Bought by
Cole Ronnie Adam and Cole Janyce
Create a Home Valuation Report for This Property
The Home Valuation Report is an in-depth analysis detailing your home's value as well as a comparison with similar homes in the area
Home Values in the Area
Average Home Value in this Area
Purchase History
| Date | Buyer | Sale Price | Title Company |
|---|---|---|---|
| Cole Ronnie Adam | -- | Chicago Title | |
| Gibson Chad J | $203,298 | First American Title | |
| Cole Ronnie Adam | -- | -- | |
| Cole Ronnie Adam | -- | -- |
Source: Public Records
Mortgage History
| Date | Status | Borrower | Loan Amount |
|---|---|---|---|
| Open | Cole Ronnie Adam | $315,000 | |
| Previous Owner | Gibson Chad J | $203,298 |
Source: Public Records
Tax History Compared to Growth
Tax History
| Year | Tax Paid | Tax Assessment Tax Assessment Total Assessment is a certain percentage of the fair market value that is determined by local assessors to be the total taxable value of land and additions on the property. | Land | Improvement |
|---|---|---|---|---|
| 2025 | $8,164 | $446,282 | $78,650 | $367,632 |
| 2024 | $8,164 | $408,508 | $23,384 | $385,124 |
| 2023 | $7,517 | $371,371 | $0 | $379,794 |
| 2022 | $8,235 | $337,610 | $0 | $352,350 |
| 2021 | $8,822 | $306,920 | $60,500 | $246,420 |
| 2020 | $8,778 | $299,370 | $55,000 | $244,370 |
| 2019 | $9,604 | $306,770 | $55,000 | $251,770 |
| 2018 | $9,143 | $291,600 | $55,000 | $236,600 |
| 2017 | $9,357 | $297,930 | $55,000 | $242,930 |
| 2016 | $9,712 | $309,240 | $55,000 | $254,240 |
| 2015 | $5,852 | $310,710 | $55,000 | $255,710 |
| 2014 | $5,295 | $274,490 | $55,000 | $219,490 |
Source: Public Records
Map
Nearby Homes
- 27514 Wilson Run Ln
- 27603 Huggins Crest Ct
- 27414 Wooded Canyon Dr
- 27419 Canyon Reach Dr
- 27415 Royal Canyon Ln
- 27411 Canyon Reach Dr
- 27423 Sunrise Ranch Ln
- 27410 Ashland Meadow Ln
- 4110 Addison Ranch Ln
- 3438 Cartwright Cliff Ln
- 3422 Walker Falls Ln
- 4314 Kent Ranch Ct
- 3715 Cardiff Mist Dr
- 28131 Twin Knolls Ln
- 4218 Brannon Branch Ct
- 28807 Mayes Bluff Dr
- 3902 Vinson Ranch Ln
- 27122 Danbridge Gulch Ln
- 27118 Cardiff Rocks Dr
- 4943 Ginger Bluff Trail
- 27514 Fleming Bluff Ct
- 27507 Wilson Run Ln
- 27518 Fleming Bluff Ct
- 27511 Wilson Run Ln
- 3819 Quinn Acres Ln
- 3815 Quinn Acres Ln
- 3811 Quinn Acres Ln
- 27515 Wilson Run Ln
- 3823 Quinn Acres Ln
- 27522 Fleming Bluff Ct
- 27511 Fleming Bluff Ct
- 27507 Fleming Bluff Ct
- 27515 Fleming Bluff Ct
- 3807 Quinn Acres Ln
- 27503 Fleming Bluff Ct
- 27519 Wilson Run Ln
- 27519 Fleming Bluff Ct
- 27526 Fleming Bluff Ct
- 27503 Fleming Bluff Ct
- 27514 Fleming Bluff Ct