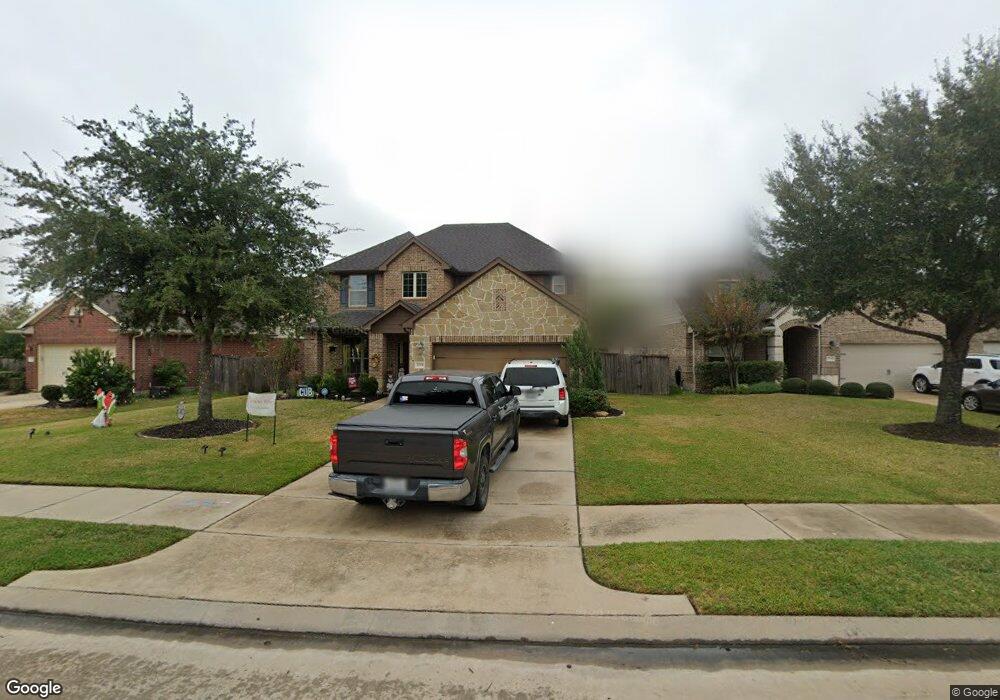
27518 Wade Springs Ct Fulshear, TX 77441
Estimated Value: $430,000 - $468,000
4
Beds
4
Baths
2,691
Sq Ft
$166/Sq Ft
Est. Value
About This Home
This home is located at 27518 Wade Springs Ct, Fulshear, TX 77441 and is currently estimated at $446,754, approximately $166 per square foot. 27518 Wade Springs Ct is a home located in Fort Bend County with nearby schools including Campbell Elementary School, Joe M. Adams Junior High, and Sugar Creek Montessori - Fulshear/West Katy.
Ownership History
Date
Name
Owned For
Owner Type
Purchase Details
Closed on
Oct 16, 2015
Sold by
Queshi Adnan A and Saab Saadia J
Bought by
Scheffer Regan Renee and Scheffer Tristan Blain
Current Estimated Value
Home Financials for this Owner
Home Financials are based on the most recent Mortgage that was taken out on this home.
Original Mortgage
$275,405
Outstanding Balance
$217,126
Interest Rate
3.94%
Mortgage Type
New Conventional
Estimated Equity
$229,628
Purchase Details
Closed on
Dec 20, 2012
Sold by
Beazer Homes Texas Lp
Bought by
Quresh Adnan A and Saad Saadia J
Home Financials for this Owner
Home Financials are based on the most recent Mortgage that was taken out on this home.
Original Mortgage
$207,494
Interest Rate
3.25%
Mortgage Type
FHA
Purchase Details
Closed on
Dec 19, 2011
Sold by
Taylor Morrison Of Texas Inc
Bought by
Scheffer Tristan Blain and Reagan Renee
Create a Home Valuation Report for This Property
The Home Valuation Report is an in-depth analysis detailing your home's value as well as a comparison with similar homes in the area
Home Values in the Area
Average Home Value in this Area
Purchase History
| Date | Buyer | Sale Price | Title Company |
|---|---|---|---|
| Scheffer Regan Renee | -- | Startex Title 11 | |
| Quresh Adnan A | -- | None Available | |
| Scheffer Tristan Blain | -- | -- | |
| Scheffer Tristan Blain | -- | -- |
Source: Public Records
Mortgage History
| Date | Status | Borrower | Loan Amount |
|---|---|---|---|
| Open | Scheffer Regan Renee | $275,405 | |
| Previous Owner | Scheffer Tristan Blain | $207,494 |
Source: Public Records
Tax History Compared to Growth
Tax History
| Year | Tax Paid | Tax Assessment Tax Assessment Total Assessment is a certain percentage of the fair market value that is determined by local assessors to be the total taxable value of land and additions on the property. | Land | Improvement |
|---|---|---|---|---|
| 2025 | $7,363 | $396,991 | $74,932 | $322,059 |
| 2024 | $7,363 | $361,875 | $16,117 | $345,758 |
| 2023 | $6,796 | $328,977 | $0 | $330,688 |
| 2022 | $7,531 | $299,070 | $0 | $312,230 |
| 2021 | $7,815 | $271,880 | $57,640 | $214,240 |
| 2020 | $7,742 | $264,060 | $44,100 | $219,960 |
| 2019 | $8,249 | $263,510 | $44,100 | $219,410 |
| 2018 | $8,067 | $257,260 | $44,100 | $213,160 |
| 2017 | $8,072 | $257,010 | $44,100 | $212,910 |
| 2016 | $8,188 | $260,720 | $44,100 | $216,620 |
| 2015 | $4,738 | $255,190 | $44,100 | $211,090 |
| 2014 | $5,007 | $260,200 | $66,150 | $194,050 |
Source: Public Records
Map
Nearby Homes
- 27423 Sunrise Ranch Ln
- 27603 Huggins Crest Ct
- 27419 Canyon Reach Dr
- 27411 Canyon Reach Dr
- 27514 Wilson Run Ln
- 3438 Cartwright Cliff Ln
- 27414 Wooded Canyon Dr
- 3422 Walker Falls Ln
- 27415 Royal Canyon Ln
- 3715 Cardiff Mist Dr
- 27118 Cardiff Rocks Dr
- 27410 Ashland Meadow Ln
- 28131 Twin Knolls Ln
- 4110 Addison Ranch Ln
- 3314 Flint Valley Ln
- 27830 Hunters Rock Ln
- 27834 Hunters Rock Ln
- 27414 Hollow Pass Ln
- 3902 Vinson Ranch Ln
- 3407 Cardiff Mist Dr
- 27514 Wade Springs Ct
- 27522 Wade Springs Ct
- 27510 Wade Springs Ct
- 27506 Wade Springs Ct
- 27515 Frazier Rock Ct
- 27519 Frazier Rock Ct
- 27519 Wade Springs Ct
- 27523 Wade Springs Ct
- 27515 Wade Springs Ct
- 27527 Wade Springs Ct
- 27507 Frazier Rock Ct
- 27511 Wade Springs Ct
- 27502 Wade Springs Ct
- 27531 Wade Springs Ct
- 27507 Wade Springs Ct
- 27503 Wade Springs Ct
- 27503 Frazier Rock Ct
- 27606 Briscoe Park Ct
- 27602 Briscoe Park Ct
- 27610 Briscoe Park Ct