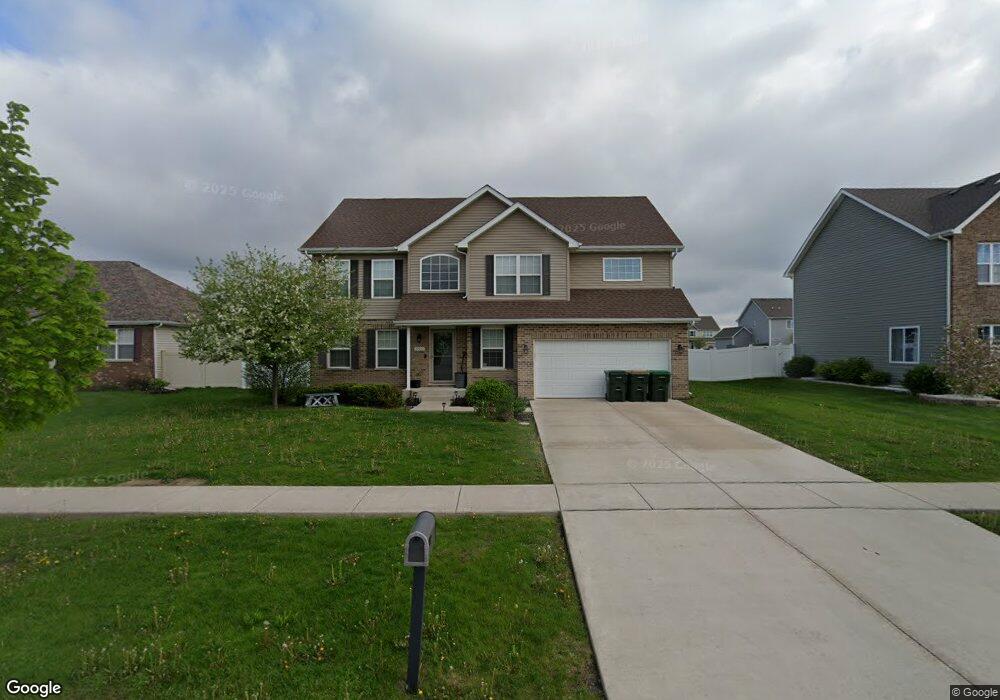
27522 W Deer Hollow Ln Channahon, IL 60410
Estimated Value: $420,000 - $454,977
4
Beds
3
Baths
2,600
Sq Ft
$168/Sq Ft
Est. Value
About This Home
This home is located at 27522 W Deer Hollow Ln, Channahon, IL 60410 and is currently estimated at $435,744, approximately $167 per square foot. 27522 W Deer Hollow Ln is a home located in Grundy County with nearby schools including Minooka Primary Center, Aux Sable Elementary School, and Minooka Junior High School.
Ownership History
Date
Name
Owned For
Owner Type
Purchase Details
Closed on
Oct 11, 2016
Sold by
Gardner Luxury Homes Llc
Bought by
Atlas Dana T and Harshfield Vancouver B
Current Estimated Value
Purchase Details
Closed on
Sep 14, 2016
Sold by
Gardner Luxury Homes Llc
Bought by
Phelan M Thomas
Purchase Details
Closed on
Nov 18, 2015
Sold by
Minooka Ag Holdings Llc
Bought by
Gardner Luxury Homes Llc
Home Financials for this Owner
Home Financials are based on the most recent Mortgage that was taken out on this home.
Original Mortgage
$325,000
Interest Rate
3.78%
Mortgage Type
Stand Alone First
Purchase Details
Closed on
Feb 18, 2014
Bought by
Minooka Ag Holdings Llc
Purchase Details
Closed on
Feb 14, 2014
Bought by
Minooka Ag Holdings Llc
Create a Home Valuation Report for This Property
The Home Valuation Report is an in-depth analysis detailing your home's value as well as a comparison with similar homes in the area
Home Values in the Area
Average Home Value in this Area
Purchase History
| Date | Buyer | Sale Price | Title Company |
|---|---|---|---|
| Atlas Dana T | $265,305 | Greater Illinois Title | |
| Phelan M Thomas | -- | None Available | |
| Gardner Luxury Homes Llc | $325,000 | Fidelity National Title Ins | |
| Minooka Ag Holdings Llc | -- | -- | |
| Minooka Ag Holdings Llc | -- | -- |
Source: Public Records
Mortgage History
| Date | Status | Borrower | Loan Amount |
|---|---|---|---|
| Previous Owner | Gardner Luxury Homes Llc | $325,000 | |
| Closed | Minooka Ag Holdings Llc | $0 |
Source: Public Records
Tax History Compared to Growth
Tax History
| Year | Tax Paid | Tax Assessment Tax Assessment Total Assessment is a certain percentage of the fair market value that is determined by local assessors to be the total taxable value of land and additions on the property. | Land | Improvement |
|---|---|---|---|---|
| 2024 | $12,390 | $148,101 | $21,672 | $126,429 |
| 2023 | $11,294 | $134,993 | $19,754 | $115,239 |
| 2022 | $9,999 | $125,516 | $18,367 | $107,149 |
| 2021 | $9,530 | $118,814 | $17,386 | $101,428 |
| 2020 | $9,283 | $113,656 | $16,631 | $97,025 |
| 2019 | $8,744 | $105,237 | $15,399 | $89,838 |
| 2018 | $8,819 | $104,060 | $15,227 | $88,833 |
| 2017 | $8,584 | $99,370 | $14,541 | $84,829 |
| 2016 | $1,764 | $19,186 | $19,186 | $0 |
| 2015 | $237 | $5,004 | $5,004 | $0 |
| 2014 | $38 | $878 | $878 | $0 |
| 2013 | -- | $0 | $0 | $0 |
Source: Public Records
Map
Nearby Homes
- The Monaco Plan at Ranch Villas at Keating Pointe
- The Tuscany Plan at Ranch Villas at Keating Pointe
- The Sienna Plan at Ranch Villas at Keating Pointe
- The Roma Plan at Ranch Villas at Keating Pointe
- The Lucca Plan at Ranch Villas at Keating Pointe
- The Capri Plan at Ranch Villas at Keating Pointe
- 25626 S Geraldine Ct
- 27357 W Porto Ln
- 27410 W Porto Ln
- The Rosewood Plan at The Preserve At Heritage Woods - The Preserve at Heritage Woods
- The Lakewood Plan at The Preserve At Heritage Woods - The Preserve at Heritage Woods
- The Cedarwood Plan at The Preserve At Heritage Woods - The Preserve at Heritage Woods
- The Beechwood Plan at The Preserve At Heritage Woods - The Preserve at Heritage Woods
- 2080 Waters Edge Dr
- 1941 Waters Edge Dr
- 1935 Waters Edge Dr
- 25441 S Mallard Dr
- 26864 Wedgewood Ln
- 1468 Sedge Pass
- 825 Grant Dr
- 27514 W Deer Hollow Ln
- 27532 W Deer Hollow Ln
- 27504 W Deer Hollow Ln
- 27521 W Red Wing Ln
- 27531 W Red Wing Ln
- 27531 Red Wing Ln
- 27505 W Red Wing Ln
- 27521 W Deer Hollow Ln
- 27462 W Deer Hollow Ln
- 27511 W Deer Hollow Ln
- 27550 W Deer Hollow Ln
- 27533 W Deer Hollow Ln
- 27503 W Deer Hollow Ln
- 27463 W Red Wing Ln
- 27454 W Deer Hollow Ln
- 27459 W Deer Hollow Ln
- 27545 W Deer Hollow Ln
- 27455 W Red Wing Ln
- 27242 & 27249 W Deer Hollow Ln
- 27656 W Deer Hollow Ln