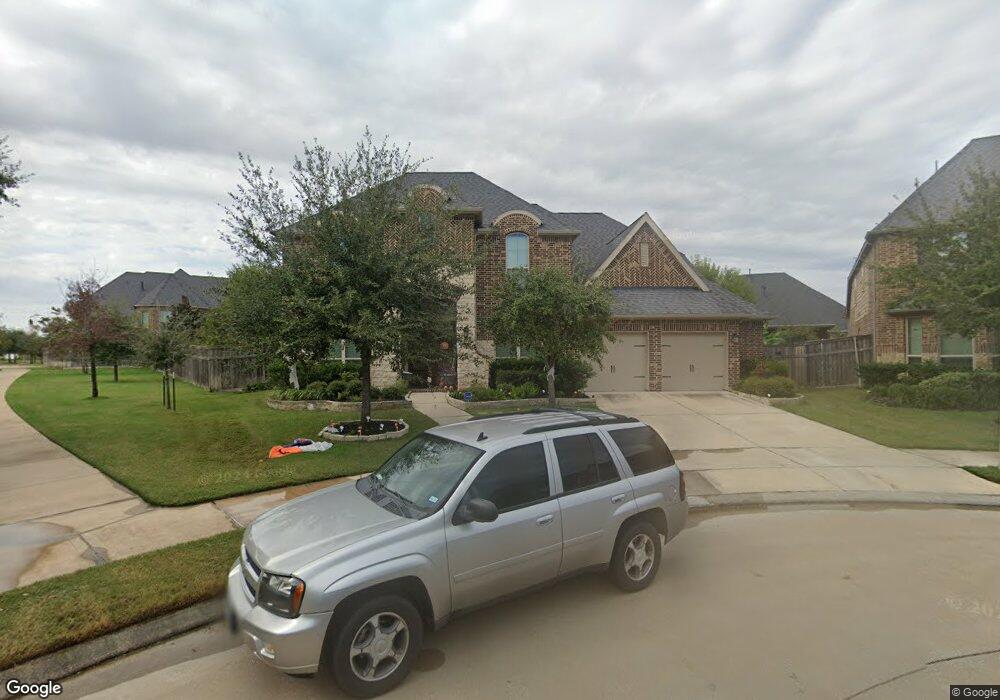
27530 Llano Meadows Ln Fulshear, TX 77441
Cross Creek Ranch NeighborhoodEstimated Value: $772,647 - $866,000
4
Beds
5
Baths
4,086
Sq Ft
$201/Sq Ft
Est. Value
About This Home
This home is located at 27530 Llano Meadows Ln, Fulshear, TX 77441 and is currently estimated at $820,412, approximately $200 per square foot. 27530 Llano Meadows Ln is a home with nearby schools including James E. Randolph Elementary School, Joe M. Adams Junior High, and Sugar Creek Montessori - Fulshear/West Katy.
Ownership History
Date
Name
Owned For
Owner Type
Purchase Details
Closed on
Oct 23, 2015
Sold by
Newmark Homes Houston Llc
Bought by
Demmink Mark
Current Estimated Value
Home Financials for this Owner
Home Financials are based on the most recent Mortgage that was taken out on this home.
Original Mortgage
$417,000
Outstanding Balance
$328,980
Interest Rate
3.96%
Mortgage Type
New Conventional
Estimated Equity
$491,432
Purchase Details
Closed on
Oct 5, 2015
Sold by
Perry Homes Llc
Bought by
Lopez Nicholas and Galindo Angelica M
Home Financials for this Owner
Home Financials are based on the most recent Mortgage that was taken out on this home.
Original Mortgage
$417,000
Outstanding Balance
$328,980
Interest Rate
3.96%
Mortgage Type
New Conventional
Estimated Equity
$491,432
Purchase Details
Closed on
Jul 18, 2014
Sold by
Ccr Loan Subsidiary 1 Lp
Bought by
Lopez Nicholas and Galindo Angelica M
Purchase Details
Closed on
Oct 2, 2013
Sold by
Ccr Loan Subsidiary 1 Lp
Bought by
Lopez Nicholas and Galindo Angelica M
Create a Home Valuation Report for This Property
The Home Valuation Report is an in-depth analysis detailing your home's value as well as a comparison with similar homes in the area
Home Values in the Area
Average Home Value in this Area
Purchase History
| Date | Buyer | Sale Price | Title Company |
|---|---|---|---|
| Demmink Mark | -- | Universal Title Partners | |
| Lopez Nicholas | -- | Chicago Title | |
| Lopez Nicholas | -- | -- | |
| Lopez Nicholas | -- | -- |
Source: Public Records
Mortgage History
| Date | Status | Borrower | Loan Amount |
|---|---|---|---|
| Open | Demmink Mark | $417,000 | |
| Closed | Lopez Nicholas | $250,000 |
Source: Public Records
Tax History Compared to Growth
Tax History
| Year | Tax Paid | Tax Assessment Tax Assessment Total Assessment is a certain percentage of the fair market value that is determined by local assessors to be the total taxable value of land and additions on the property. | Land | Improvement |
|---|---|---|---|---|
| 2025 | $9,717 | $704,112 | $106,080 | $701,800 |
| 2024 | $9,717 | $640,102 | $25,226 | $614,876 |
| 2023 | $13,785 | $581,911 | $0 | $652,484 |
| 2022 | $14,624 | $529,010 | $0 | $539,140 |
| 2021 | $15,089 | $480,920 | $68,000 | $412,920 |
| 2020 | $15,287 | $471,940 | $79,380 | $392,560 |
| 2019 | $15,922 | $467,860 | $79,380 | $388,480 |
| 2018 | $16,071 | $468,640 | $79,380 | $389,260 |
| 2017 | $16,764 | $484,150 | $79,380 | $404,770 |
| 2016 | $16,686 | $481,900 | $79,380 | $402,520 |
| 2015 | $1,155 | $51,000 | $51,000 | $0 |
| 2014 | $1,007 | $44,000 | $44,000 | $0 |
Source: Public Records
Map
Nearby Homes
- 27602 Lakeway Trail Ln
- 4915 Medina Bend Ln
- 27602 Balcones Heights Blvd
- 4930 Scenic Horizon Ln
- 5122 Bartlett Vista Ct
- 5102 Kendalia Cloud Ln
- 27330 Aspen Falls Ln
- 27919 Starlight Harbor Ln
- 27318 Symphony Creek Ln
- 4218 Brannon Branch Ct
- 27842 Harper Meadow Ln
- 27231 Symphony Creek Ln
- 27127 Birch Pine Ct
- 5303 Briarcliff Ln
- 4110 Addison Ranch Ln
- 4943 Ginger Bluff Trail
- 5310 Briarcliff Ln
- 28807 Mayes Bluff Dr
- 5431 Caspian Falls Ln
- 32919 Southern Manors Dr
- 27526 Llano Meadows Ln
- 27623 Lakeway Trail Ln
- 27619 Lakeway Trail Ln
- 27527 Llano Meadows Ln
- 27615 Lakeway Trail Ln
- 27522 Llano Meadows Ln
- 27523 Llano Meadows Ln
- 27627 Lakeway Trail Ln
- 27627 Lakeway Trail Ln
- 27611 Lakeway Trail Ln
- 27518 Llano Meadows Ln
- 27519 Llano Meadows Ln
- 27707 Lakeway Trail Ln
- 27607 Lakeway Trail Ln
- 27519 Llano Meadows Ln
- 27715 Lakeway Trail Ln
- 27711 Lakeway Trail Ln
- 27618 Lakeway Trail Ln
- 27515 Llano Meadows Ln
- 27603 Lakeway Trail Ln