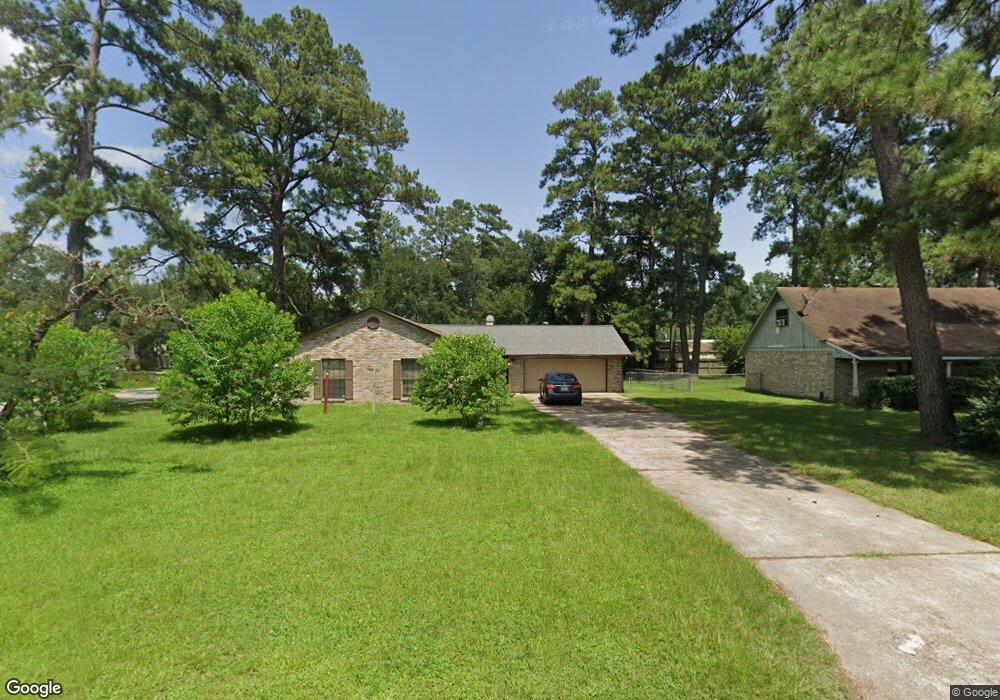
27538 Decker Prairie Rosehl Rd Magnolia, TX 77355
Estimated Value: $270,855 - $385,000
3
Beds
2
Baths
1,653
Sq Ft
$192/Sq Ft
Est. Value
About This Home
This home is located at 27538 Decker Prairie Rosehl Rd, Magnolia, TX 77355 and is currently estimated at $317,464, approximately $192 per square foot. 27538 Decker Prairie Rosehl Rd is a home located in Montgomery County with nearby schools including Decker Prairie Elementary School, Tomball Intermediate School, and Tomball Junior High School.
Ownership History
Date
Name
Owned For
Owner Type
Purchase Details
Closed on
Aug 14, 2006
Sold by
Arriaga Moreno Juan J
Bought by
Zelaya Ondina E
Current Estimated Value
Purchase Details
Closed on
Aug 29, 2005
Sold by
Baker Gary M and Baker Cynthia M
Bought by
Arriaga Moreno Juan J
Home Financials for this Owner
Home Financials are based on the most recent Mortgage that was taken out on this home.
Original Mortgage
$93,500
Interest Rate
5.81%
Mortgage Type
Fannie Mae Freddie Mac
Purchase Details
Closed on
Feb 28, 1997
Sold by
Gilliland Loyd Rodel and Gilliland Loyd Rodell
Bought by
Baker Gary M and Baker Cynthia M
Home Financials for this Owner
Home Financials are based on the most recent Mortgage that was taken out on this home.
Original Mortgage
$62,100
Interest Rate
7.88%
Mortgage Type
Construction
Purchase Details
Closed on
Jan 31, 1990
Sold by
Farm & Home Savings
Bought by
Zelaya Ondina E
Create a Home Valuation Report for This Property
The Home Valuation Report is an in-depth analysis detailing your home's value as well as a comparison with similar homes in the area
Home Values in the Area
Average Home Value in this Area
Purchase History
| Date | Buyer | Sale Price | Title Company |
|---|---|---|---|
| Zelaya Ondina E | -- | Southern American Title | |
| Arriaga Moreno Juan J | -- | Stewart Title | |
| Baker Gary M | -- | -- | |
| Zelaya Ondina E | -- | -- |
Source: Public Records
Mortgage History
| Date | Status | Borrower | Loan Amount |
|---|---|---|---|
| Previous Owner | Arriaga Moreno Juan J | $93,500 | |
| Previous Owner | Baker Gary M | $62,100 |
Source: Public Records
Tax History Compared to Growth
Tax History
| Year | Tax Paid | Tax Assessment Tax Assessment Total Assessment is a certain percentage of the fair market value that is determined by local assessors to be the total taxable value of land and additions on the property. | Land | Improvement |
|---|---|---|---|---|
| 2025 | $2,280 | $220,164 | $26,524 | $193,640 |
| 2024 | $1,965 | $209,935 | -- | -- |
| 2023 | $1,965 | $190,850 | $26,520 | $180,520 |
| 2022 | $3,205 | $173,500 | $26,520 | $180,520 |
| 2021 | $3,031 | $157,730 | $26,520 | $131,210 |
| 2020 | $3,221 | $160,720 | $26,520 | $146,140 |
| 2019 | $2,885 | $146,110 | $26,520 | $119,590 |
| 2018 | $2,440 | $141,220 | $26,520 | $114,700 |
| 2017 | $2,692 | $129,350 | $8,100 | $121,250 |
| 2016 | $2,521 | $121,130 | $8,100 | $115,240 |
| 2015 | $1,908 | $110,120 | $8,100 | $115,240 |
| 2014 | $1,908 | $100,110 | $8,100 | $92,010 |
Source: Public Records
Map
Nearby Homes
- 12015 Helene Ct
- 32214 Annice Ln
- 12102 Carol Ln
- 31523 Johlke Rd
- 32126 Annice Ln
- 32035 Annice Ln
- 12038 Powderhorn Ln
- 32006 Annice Ln
- 32015 Sue Ln
- 11726 Elizabeth Ct
- 32002 Sue Ln
- 802 Sentinel Oaks
- 11919 Hickory Wood St
- 611 Sentinel Oaks
- 819 Sentinel Oaks
- 12515 Lazywood St
- 902 Falcon Hollow Ln
- 915 Falcon Hollow Ln
- 25429 Hardin Store Rd
- 0 TBD Cripple Creek Dr
- 27538 N Decker Prairie
- 27536 Decker Prairie Rosehl Rd
- 27614 Decker Prairie Rosehl Rd
- 32103 Decker Pines St
- 27526 Decker Prairie Rosehl Rd
- 27618 Decker Prairie Rosehl Rd
- 27615 Christiana Dr
- 27522 Decker Prairie Rosehl Rd
- 32111 Decker Pines St
- 27622 Decker Prairie Rosehl Rd
- 0 Decker Prairie-Rosehill Rd
- 32102 Decker Pines St
- 27623 Christiana Dr
- 32119 Decker Pines St
- 32110 Decker Pines St
- 27514 Decker Prairie Rosehl Rd
- 27710 Decker Prairie Rosehl Rd
- 27614 Christiana Dr
- 32127 Decker Pines St
- 32118 Decker Pines St