Estimated Value: $275,000 - $319,000
3
Beds
2
Baths
1,778
Sq Ft
$168/Sq Ft
Est. Value
About This Home
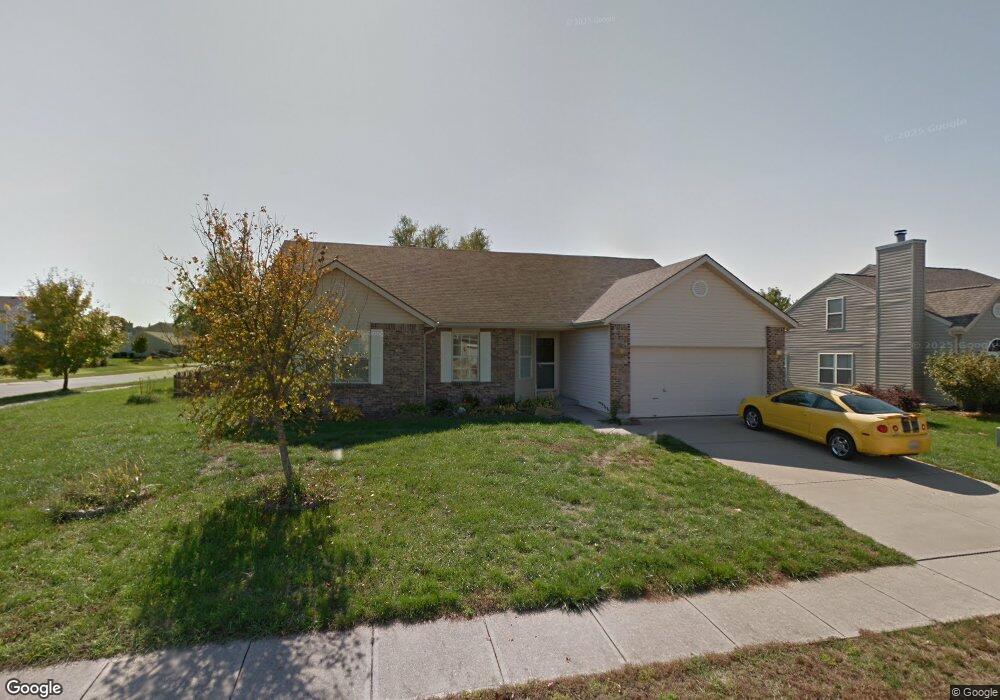
This home is located at 2755 N Barnhill Place, Xenia, OH 45385 and is currently estimated at $298,184, approximately $167 per square foot. 2755 N Barnhill Place is a home located in Greene County with nearby schools including Xenia High School and Summit Academy Community School for Alternative Learners - Xenia.
Ownership History
Date
Name
Owned For
Owner Type
Purchase Details
Closed on
Nov 12, 2010
Sold by
Vance Stacy E
Bought by
Vance Jeremy R
Current Estimated Value
Home Financials for this Owner
Home Financials are based on the most recent Mortgage that was taken out on this home.
Original Mortgage
$139,060
Outstanding Balance
$94,514
Interest Rate
4.87%
Mortgage Type
FHA
Estimated Equity
$203,670
Purchase Details
Closed on
Apr 23, 2009
Sold by
Taylor Azalene
Bought by
Vance Jeremy R and Vance Stacy E
Home Financials for this Owner
Home Financials are based on the most recent Mortgage that was taken out on this home.
Original Mortgage
$140,160
Interest Rate
5.05%
Mortgage Type
FHA
Purchase Details
Closed on
Aug 6, 2007
Sold by
Breeding Azalene T and Taylor Azalene
Bought by
Taylor Azalene
Purchase Details
Closed on
Jul 1, 1998
Sold by
Crossmann Communities Of Ohio
Bought by
Breeding Azalene T
Create a Home Valuation Report for This Property
The Home Valuation Report is an in-depth analysis detailing your home's value as well as a comparison with similar homes in the area
Home Values in the Area
Average Home Value in this Area
Purchase History
| Date | Buyer | Sale Price | Title Company |
|---|---|---|---|
| Vance Jeremy R | -- | Attorney | |
| Vance Jeremy R | $145,000 | Attorney | |
| Taylor Azalene | -- | Attorney | |
| Breeding Azalene T | $139,000 | -- |
Source: Public Records
Mortgage History
| Date | Status | Borrower | Loan Amount |
|---|---|---|---|
| Open | Vance Jeremy R | $139,060 | |
| Closed | Vance Jeremy R | $140,160 |
Source: Public Records
Tax History Compared to Growth
Tax History
| Year | Tax Paid | Tax Assessment Tax Assessment Total Assessment is a certain percentage of the fair market value that is determined by local assessors to be the total taxable value of land and additions on the property. | Land | Improvement |
|---|---|---|---|---|
| 2024 | $3,472 | $81,140 | $19,340 | $61,800 |
| 2023 | $3,472 | $81,140 | $19,340 | $61,800 |
| 2022 | $3,059 | $60,980 | $12,890 | $48,090 |
| 2021 | $3,100 | $60,980 | $12,890 | $48,090 |
| 2020 | $2,970 | $60,980 | $12,890 | $48,090 |
| 2019 | $2,530 | $48,900 | $9,880 | $39,020 |
| 2018 | $2,540 | $48,900 | $9,880 | $39,020 |
| 2017 | $2,505 | $48,900 | $9,880 | $39,020 |
| 2016 | $2,506 | $47,330 | $9,880 | $37,450 |
| 2015 | $2,512 | $47,330 | $9,880 | $37,450 |
| 2014 | $2,406 | $47,330 | $9,880 | $37,450 |
Source: Public Records
Map
Nearby Homes
- 2784 Greystoke Dr
- 2821 Raxit Ct
- 0 Berkshire Dr Unit 942854
- 1318 Prem Place
- 2540 Cornwall Dr
- 2421 Louisiana Dr
- 2540 Jenny Marie Dr
- 1304 Baybury Ave
- 2705 Tennessee Dr
- 1248 Prem Place
- 1298 Baybury Ave
- 1282 Baybury Ave
- 2499 Jenny Marie Dr
- 1213 Prem Place
- 1293 Baybury Ave
- 1272 Baybury Ave
- 1292 Baybury Ave
- 2692 Kingman Dr
- 1161 Shannon Ln
- 2345 Tennessee Dr
- 2763 N Barnhill Place
- 2768 Greystoke Dr
- 2737 Barnhill Ct
- 2776 Greystoke Dr
- 2769 N Barnhill Place
- 2758 N Barnhill Place
- 2762 Greystoke Dr
- 2766 N Barnhill Place
- 2714 Barnhill Ct
- 2775 Kearney Ln
- 2729 Barnhill Ct
- 2752 Greystoke Dr
- 2777 N Barnhill Place
- 2780 N Barnhill Place
- 2792 Greystoke Dr
- 2762 Kearney Ln
- 2769 Kearney Ln
- 1402 E Kearney Ln
- 2721 Barnhill Ct
- 2746 Greystoke Dr