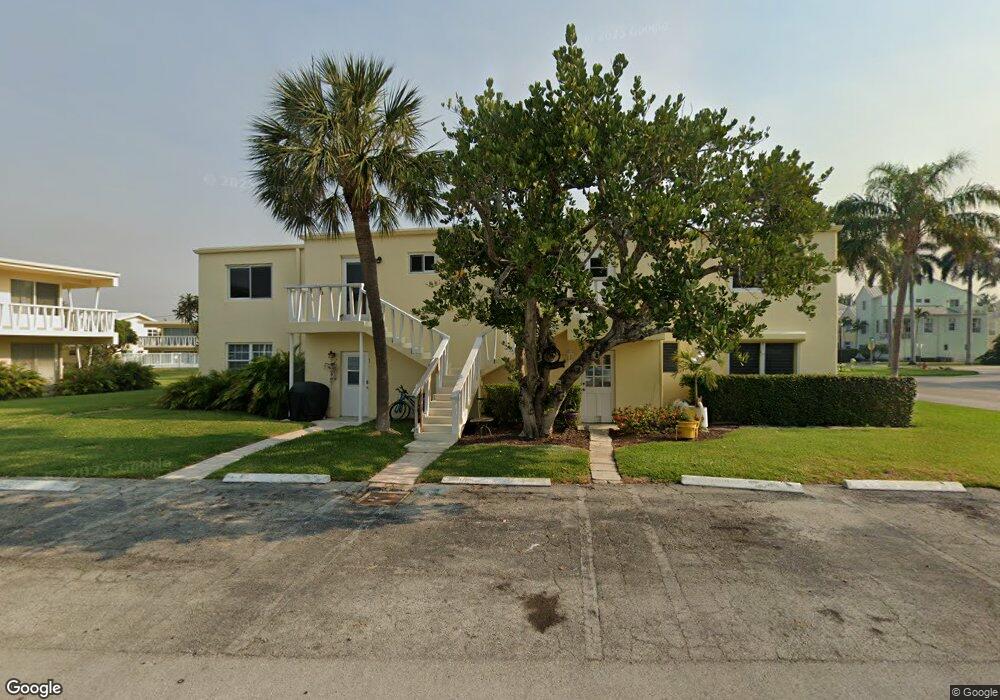
2755 NE 28th Ave Unit F3 Lighthouse Point, FL 33064
Estimated Value: $322,000 - $366,000
3
Beds
2
Baths
1,180
Sq Ft
$287/Sq Ft
Est. Value
About This Home
This home is located at 2755 NE 28th Ave Unit F3, Lighthouse Point, FL 33064 and is currently estimated at $338,915, approximately $287 per square foot. 2755 NE 28th Ave Unit F3 is a home located in Broward County with nearby schools including Norcrest Elementary School, Deerfield Beach Middle School, and Deerfield Beach High School.
Ownership History
Date
Name
Owned For
Owner Type
Purchase Details
Closed on
Feb 19, 2025
Sold by
Wolf James
Bought by
James J Wolf Revocable Trust and Wolf
Current Estimated Value
Purchase Details
Closed on
Nov 13, 2006
Sold by
Casazza Nicole D
Bought by
Wolf James
Home Financials for this Owner
Home Financials are based on the most recent Mortgage that was taken out on this home.
Original Mortgage
$212,000
Interest Rate
6.31%
Mortgage Type
Purchase Money Mortgage
Purchase Details
Closed on
Aug 19, 2005
Sold by
Strawbridge Duane and Strawbridge Mary Lee
Bought by
Casazza Nicole D
Home Financials for this Owner
Home Financials are based on the most recent Mortgage that was taken out on this home.
Original Mortgage
$35,356
Interest Rate
5.71%
Mortgage Type
Credit Line Revolving
Create a Home Valuation Report for This Property
The Home Valuation Report is an in-depth analysis detailing your home's value as well as a comparison with similar homes in the area
Home Values in the Area
Average Home Value in this Area
Purchase History
| Date | Buyer | Sale Price | Title Company |
|---|---|---|---|
| James J Wolf Revocable Trust | -- | None Listed On Document | |
| Wolf James | $280,000 | New Republic Title Inc | |
| Casazza Nicole D | $235,800 | Integrity Title Inc |
Source: Public Records
Mortgage History
| Date | Status | Borrower | Loan Amount |
|---|---|---|---|
| Previous Owner | Wolf James | $212,000 | |
| Previous Owner | Casazza Nicole D | $35,356 | |
| Previous Owner | Casazza Nicole D | $188,568 |
Source: Public Records
Tax History Compared to Growth
Tax History
| Year | Tax Paid | Tax Assessment Tax Assessment Total Assessment is a certain percentage of the fair market value that is determined by local assessors to be the total taxable value of land and additions on the property. | Land | Improvement |
|---|---|---|---|---|
| 2025 | $5,635 | $262,520 | -- | -- |
| 2024 | $5,327 | $262,520 | -- | -- |
| 2023 | $5,327 | $216,970 | $0 | $0 |
| 2022 | $4,433 | $197,250 | $0 | $0 |
| 2021 | $3,953 | $179,320 | $17,930 | $161,390 |
| 2020 | $3,777 | $186,820 | $18,680 | $168,140 |
| 2019 | $3,679 | $196,580 | $19,660 | $176,920 |
| 2018 | $3,448 | $205,910 | $20,590 | $185,320 |
| 2017 | $3,076 | $124,450 | $0 | $0 |
| 2016 | $2,896 | $113,140 | $0 | $0 |
| 2015 | $2,322 | $102,860 | $0 | $0 |
| 2014 | $2,157 | $93,510 | $0 | $0 |
| 2013 | -- | $85,010 | $8,500 | $76,510 |
Source: Public Records
Map
Nearby Homes
- 2800 NE 28th St Unit 5
- 2748 NE 28th Ave Unit 13
- 2755 NE 28th Ave Unit A3
- 2741-2745 NE 30th Ave
- 2753 NE 28th St Unit 2E
- 2737 NE 28th St Unit 7W
- 2727 NE 30th Ave
- 2727 NE 30th Ave Unit 1-4
- 2772 NE 30th Ave Unit 8
- 2800 NE 30th Ave Unit 10D
- 2912 NE 27th St
- 2743 NE 28th Ct Unit 3
- 2622 NE 27th Ave
- 2735 NE 28th Ct
- 2798 NE 24th St
- 2642 NE 26th Terrace
- 2637 NE 28th Ct
- 2614 NE 26th Terrace
- 2797 NE 26th Ave
- 2728 NE 30th St
- 2755 NE 28th Ave
- 2755 NE 28th Ave Unit 1
- 2755 NE 28th Ave Unit E3
- 2755 NE 28th Ave Unit C4
- 2755 NE 28th Ave Unit A1
- 2755 NE 28th Ave Unit B2
- 2755 NE 28th Ave Unit F6
- 2755 NE 28th Ave Unit C2
- 2755 NE 28th Ave Unit B4
- 2755 NE 28th Ave Unit D2
- 2755 NE 28th Ave Unit C1
- 2755 NE 28th Ave Unit F1
- 2755 NE 28th Ave Unit E1
- 2755 NE 28th Ave Unit A4
- 2755 NE 28th Ave Unit B3
- 2755 NE 28th Ave Unit E5
- 2755 NE 28th Ave Unit D3
- 2755 NE 28th Ave Unit E4
- 2755 NE 28th Ave Unit C3