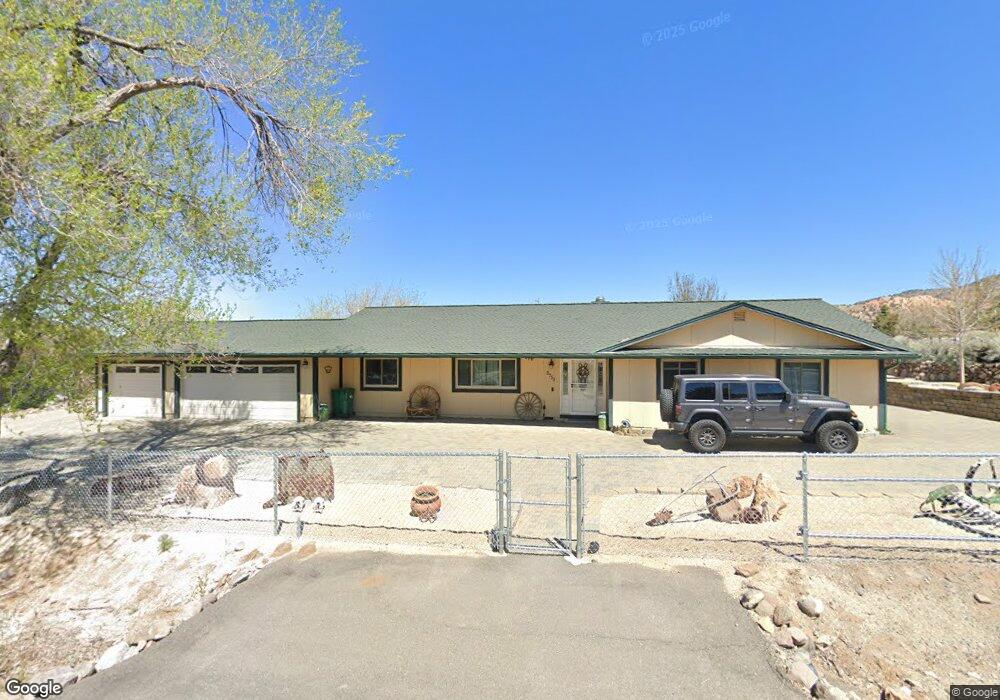
2755 Ramona Rd Unit 1 Reno, NV 89521
Hidden Lake NeighborhoodEstimated Value: $671,000 - $977,000
4
Beds
3
Baths
2,296
Sq Ft
$340/Sq Ft
Est. Value
About This Home
This home is located at 2755 Ramona Rd Unit 1, Reno, NV 89521 and is currently estimated at $779,568, approximately $339 per square foot. 2755 Ramona Rd Unit 1 is a home located in Washoe County with nearby schools including Brown Elementary School, Marce Herz Middle School, and Galena High School.
Ownership History
Date
Name
Owned For
Owner Type
Purchase Details
Closed on
Apr 6, 2018
Sold by
Johnson Stacy M and Johnson Gregory B
Bought by
Johnson Gregory B and Johnson Stacy M
Current Estimated Value
Purchase Details
Closed on
Mar 18, 2014
Sold by
Myres Eva Sue
Bought by
Johnson Gregory B and Johnson Stacy M
Purchase Details
Closed on
Oct 10, 2013
Sold by
Myres Eva S and Myres Eva Sue
Bought by
Myres Eva Sue and Eva Sue Myres Trust
Purchase Details
Closed on
Sep 15, 2011
Sold by
Federal National Mortgage Association
Bought by
Myres Eva S
Purchase Details
Closed on
May 26, 2010
Sold by
English William C
Bought by
Federal National Mortgage Association
Purchase Details
Closed on
Oct 16, 2003
Sold by
Vasser Dorothy J and The Vasser Family Trust
Bought by
English William C
Home Financials for this Owner
Home Financials are based on the most recent Mortgage that was taken out on this home.
Original Mortgage
$204,000
Interest Rate
6.14%
Mortgage Type
Unknown
Create a Home Valuation Report for This Property
The Home Valuation Report is an in-depth analysis detailing your home's value as well as a comparison with similar homes in the area
Home Values in the Area
Average Home Value in this Area
Purchase History
| Date | Buyer | Sale Price | Title Company |
|---|---|---|---|
| Johnson Gregory B | -- | None Available | |
| Johnson Gregory B | $150,000 | None Available | |
| Myres Eva Sue | -- | None Available | |
| Myres Eva S | $170,000 | Servicelink Irvine | |
| Federal National Mortgage Association | $298,658 | Lsi Title Agency Inc | |
| English William C | $697,000 | Stewart Title Of Northern Nv |
Source: Public Records
Mortgage History
| Date | Status | Borrower | Loan Amount |
|---|---|---|---|
| Previous Owner | English William C | $204,000 |
Source: Public Records
Tax History Compared to Growth
Tax History
| Year | Tax Paid | Tax Assessment Tax Assessment Total Assessment is a certain percentage of the fair market value that is determined by local assessors to be the total taxable value of land and additions on the property. | Land | Improvement |
|---|---|---|---|---|
| 2025 | $3,351 | $126,901 | $63,000 | $63,901 |
| 2024 | $3,351 | $131,029 | $55,125 | $75,904 |
| 2023 | $3,175 | $116,630 | $47,250 | $69,381 |
| 2022 | $3,082 | $96,184 | $38,500 | $57,684 |
| 2021 | $2,993 | $92,726 | $33,950 | $58,776 |
| 2020 | $2,904 | $93,527 | $32,935 | $60,592 |
| 2019 | $2,820 | $90,456 | $31,360 | $59,096 |
| 2018 | $2,738 | $89,007 | $30,450 | $58,557 |
| 2017 | $2,627 | $87,320 | $29,750 | $57,570 |
| 2016 | $2,048 | $71,061 | $29,750 | $41,311 |
| 2015 | $1,967 | $68,736 | $29,750 | $38,986 |
| 2014 | $1,910 | $60,838 | $22,750 | $38,088 |
| 2013 | -- | $57,217 | $19,250 | $37,967 |
Source: Public Records
Map
Nearby Homes
- 17144 Majestic View Dr
- 0 Rocky Vista Rd Unit 250056537
- 15770 Rocky Vista Rd
- 0 Chance Ln
- 0 Temple Hill Rd
- 1255 Willomonte Rd
- 18500 Toll Rd
- 000 Geiger Grade Unit (016-751-03)
- 1020 N Cantlon Ln
- 95 Ox-Yoke Ln
- 15165 Bailey Canyon Dr
- 68 Zircon Dr
- 15075 Western Springs Ct
- 40 Zircon Dr Unit 22
- APN 01676228 Geiger Grade Rd
- APN 01676229 Geiger Grade Rd
- 95 Hidden Lake Dr
- 255 Zircon Dr
- 16260 Rhyolite Cir
- 14690 Rancheros Dr
- 2775 Ramona Rd
- 2715 Ramona Rd
- 2770 Ramona Rd
- 2790 Ramona Rd
- 2795 Ramona Rd
- 2810 Ramona Rd
- 2730 Ramona Rd
- 2675 Ramona Rd
- 2815 Ramona Rd
- 2710 Ramona Rd
- 2770 Ravazza Rd
- 2750 Ravazza Rd
- 2830 Ramona Rd
- 2670 Ravazza Rd
- 2790 Ravazza Rd
- 2710 Ravazza Rd
- 2750 Ramona Rd
- 2835 Ramona Rd
- 2810 Ravazza Rd
- 0 Ravazza Rd Unit 80009337