Estimated Value: $595,055 - $645,000
4
Beds
3
Baths
1,798
Sq Ft
$349/Sq Ft
Est. Value
About This Home
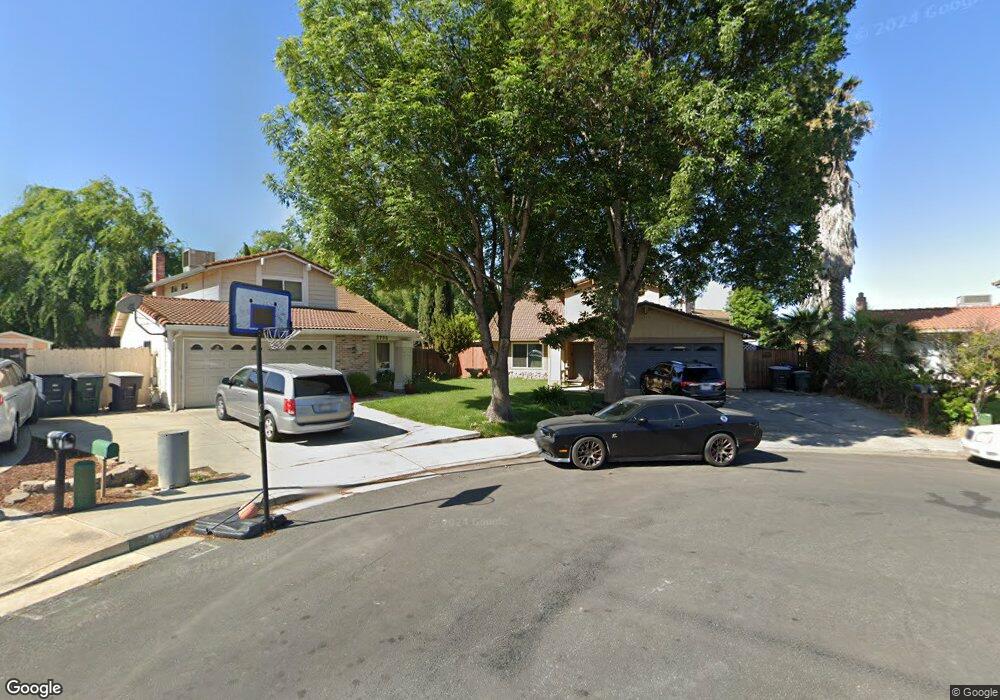
This home is located at 2755 Rhett Ct, Tracy, CA 95376 and is currently estimated at $626,764, approximately $348 per square foot. 2755 Rhett Ct is a home located in San Joaquin County with nearby schools including Melville S. Jacobson Elementary School, Monte Vista Middle School, and Merrill F. West High School.
Ownership History
Date
Name
Owned For
Owner Type
Purchase Details
Closed on
Jun 10, 2014
Sold by
Vanvannguyen Van Van and Nguyen Tu Thi
Bought by
Gonzalez Pearl M and Jimenez Carlo A
Current Estimated Value
Home Financials for this Owner
Home Financials are based on the most recent Mortgage that was taken out on this home.
Original Mortgage
$244,000
Outstanding Balance
$185,382
Interest Rate
4.17%
Mortgage Type
New Conventional
Estimated Equity
$441,382
Create a Home Valuation Report for This Property
The Home Valuation Report is an in-depth analysis detailing your home's value as well as a comparison with similar homes in the area
Home Values in the Area
Average Home Value in this Area
Purchase History
| Date | Buyer | Sale Price | Title Company |
|---|---|---|---|
| Gonzalez Pearl M | $317,000 | Fidelity National Title Co |
Source: Public Records
Mortgage History
| Date | Status | Borrower | Loan Amount |
|---|---|---|---|
| Open | Gonzalez Pearl M | $244,000 |
Source: Public Records
Tax History
| Year | Tax Paid | Tax Assessment Tax Assessment Total Assessment is a certain percentage of the fair market value that is determined by local assessors to be the total taxable value of land and additions on the property. | Land | Improvement |
|---|---|---|---|---|
| 2025 | $4,402 | $388,586 | $136,004 | $252,582 |
| 2024 | $4,054 | $380,968 | $133,338 | $247,630 |
| 2023 | $3,990 | $373,499 | $130,724 | $242,775 |
| 2022 | $3,907 | $366,176 | $128,161 | $238,015 |
| 2021 | $3,860 | $358,998 | $125,649 | $233,349 |
| 2020 | $3,834 | $355,318 | $124,361 | $230,957 |
| 2019 | $3,772 | $348,352 | $121,923 | $226,429 |
| 2018 | $3,708 | $341,523 | $119,533 | $221,990 |
| 2017 | $3,521 | $334,828 | $117,190 | $217,638 |
| 2016 | $3,563 | $328,263 | $114,892 | $213,371 |
| 2014 | $3,153 | $293,996 | $127,531 | $166,465 |
Source: Public Records
Map
Nearby Homes
- 3241 Arnaudo Ln
- 1455 Busca Dr
- 2159 Walsingham Ct Unit 62
- 2640 Lincoln Blvd
- 875 Westleigh Ct
- 335 W Clover Rd
- 252 W Clover Rd Unit A
- 41 W Kavanagh Ave
- 1940 Wall St
- 1930 Wall St
- 2935 Holly Dr
- 1823 Wall St
- 539 W Lowell Ave
- 206 W 20th St
- 535 W Lowell Ave
- 445 W Lowell Ave
- 2734 Balboa Dr
- 2904 Balboa Dr
- 262 W Lowell Ave
- 1800 Duncan Dr
Your Personal Tour Guide
Ask me questions while you tour the home.