Estimated Value: $353,971 - $389,000
4
Beds
3
Baths
2,072
Sq Ft
$179/Sq Ft
Est. Value
About This Home
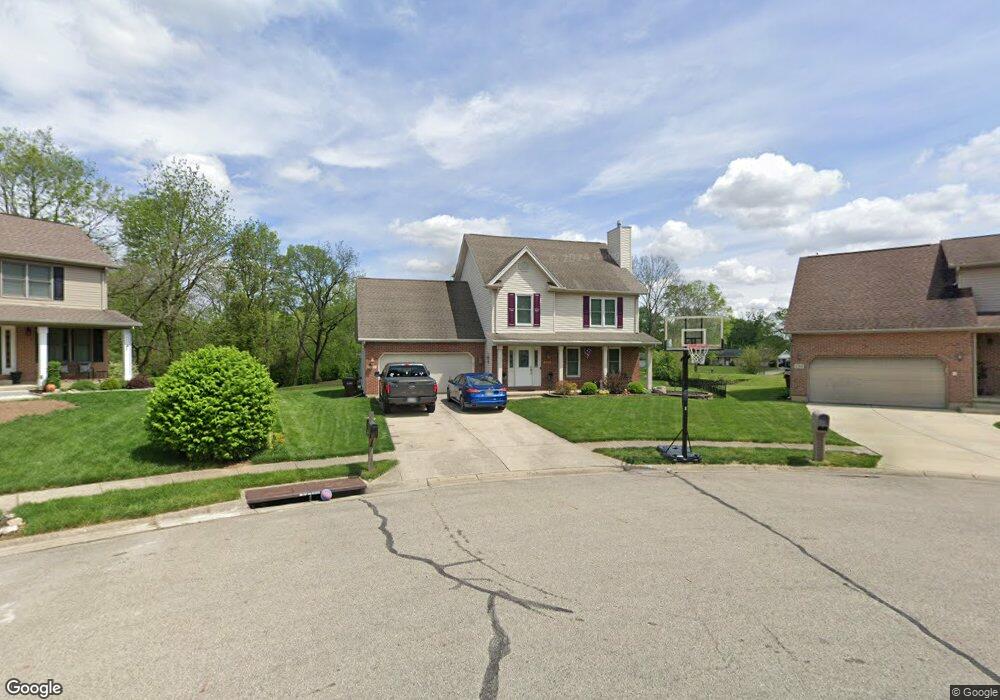
This home is located at 2755 Silver Maple Ct, Troy, OH 45373 and is currently estimated at $371,243, approximately $179 per square foot. 2755 Silver Maple Ct is a home located in Miami County with nearby schools including Concord Elementary School, Van Cleve Elementary School, and Troy Junior High School.
Ownership History
Date
Name
Owned For
Owner Type
Purchase Details
Closed on
Feb 15, 2015
Sold by
Przybelski Mitchell J and Przbelski Angela L
Bought by
Almeida Derek L and Almeida Julie M
Current Estimated Value
Home Financials for this Owner
Home Financials are based on the most recent Mortgage that was taken out on this home.
Original Mortgage
$165,000
Interest Rate
3.73%
Mortgage Type
New Conventional
Purchase Details
Closed on
Nov 30, 2004
Sold by
Creech Janet L and Scott Creech R
Bought by
Foster Carl R and Foster Maila B
Home Financials for this Owner
Home Financials are based on the most recent Mortgage that was taken out on this home.
Original Mortgage
$149,600
Interest Rate
5.86%
Mortgage Type
New Conventional
Purchase Details
Closed on
Aug 22, 1995
Sold by
Kegley Glennis
Bought by
Griesmer Denis A and Griesmer Rene J
Home Financials for this Owner
Home Financials are based on the most recent Mortgage that was taken out on this home.
Original Mortgage
$149,625
Interest Rate
7.64%
Mortgage Type
New Conventional
Create a Home Valuation Report for This Property
The Home Valuation Report is an in-depth analysis detailing your home's value as well as a comparison with similar homes in the area
Home Values in the Area
Average Home Value in this Area
Purchase History
| Date | Buyer | Sale Price | Title Company |
|---|---|---|---|
| Almeida Derek L | $180,000 | Attorney | |
| Foster Carl R | $187,000 | -- | |
| Griesmer Denis A | $166,250 | -- |
Source: Public Records
Mortgage History
| Date | Status | Borrower | Loan Amount |
|---|---|---|---|
| Previous Owner | Almeida Derek L | $165,000 | |
| Previous Owner | Foster Carl R | $149,600 | |
| Previous Owner | Griesmer Denis A | $149,625 |
Source: Public Records
Tax History
| Year | Tax Paid | Tax Assessment Tax Assessment Total Assessment is a certain percentage of the fair market value that is determined by local assessors to be the total taxable value of land and additions on the property. | Land | Improvement |
|---|---|---|---|---|
| 2025 | $4,160 | $116,730 | $14,280 | $102,450 |
| 2024 | $4,160 | $94,150 | $17,150 | $77,000 |
| 2023 | $3,658 | $94,150 | $17,150 | $77,000 |
| 2022 | $3,064 | $94,150 | $17,150 | $77,000 |
| 2021 | $2,719 | $78,440 | $14,280 | $64,160 |
| 2020 | $2,722 | $78,440 | $14,280 | $64,160 |
| 2019 | $2,747 | $78,440 | $14,280 | $64,160 |
| 2018 | $2,441 | $66,400 | $15,440 | $50,960 |
| 2017 | $2,464 | $66,400 | $15,440 | $50,960 |
| 2016 | $2,430 | $66,400 | $15,440 | $50,960 |
| 2015 | $2,339 | $61,460 | $14,280 | $47,180 |
| 2014 | $2,339 | $61,460 | $14,280 | $47,180 |
| 2013 | $2,354 | $61,460 | $14,280 | $47,180 |
Source: Public Records
Map
Nearby Homes
- 2882 Red Oak Cir
- 173 Countryside Dr N
- 20 Boone Dr
- 591 Countryside Dr S
- 120 Windmere Dr
- 2550 Broken Woods Dr
- 3135 Honeysuckle Dr
- 2685 Merrimont Dr
- 0 Lincolnshire Unit 939331
- 999 Brookwood Dr
- 974 Stony Brook Ln
- 2215 Merrimont Dr
- 2065 S Co Road 25a
- 2672 Pleasant View Dr
- 2650 Pleasant View Dr
- 1245 Wind Rock Dr
- 1704 Chevington Chase
- 1704 Chevington Chase
- 1234 Wind Rock Dr
- 1117 Honeydew Dr
- 2762 Silver Maple Ct
- 2770 Rosewood Dr
- 2772 Silver Maple Ct
- 2775 Silver Maple Ct
- 2730 Rosewood Dr
- 2788 Silver Maple Ct
- 2805 Silver Maple Ct
- 2820 Stone Circle Dr
- 2756 Walnut Ridge Dr
- 105 Countryside Dr N
- 2706 Walnut Ridge Dr
- 2770 Walnut Ridge Dr
- 115 Countryside Dr N
- 2765 Rosewood Dr
- 2700 Rosewood Dr
- 2765 Walnut Ridge Dr
- 2784 Walnut Ridge Dr
- 2711 Walnut Ridge Dr
- 2690 Walnut Ridge Dr
- 125 Countryside Dr N
Your Personal Tour Guide
Ask me questions while you tour the home.