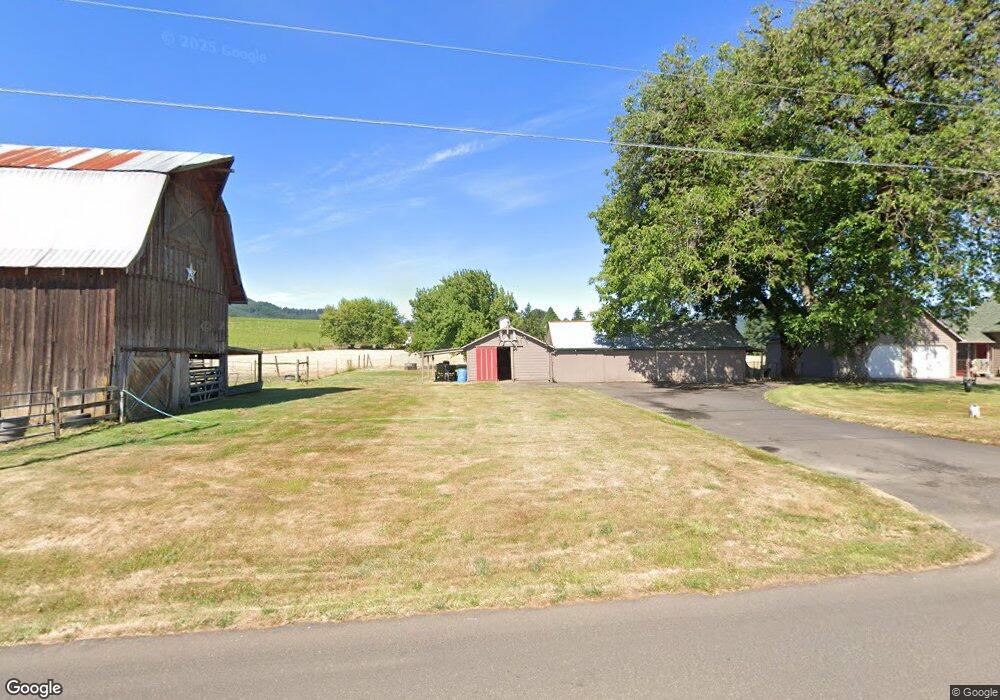
2755 SW Dilley Rd Forest Grove, OR 97116
Estimated Value: $687,960
3
Beds
1
Bath
1,908
Sq Ft
$361/Sq Ft
Est. Value
About This Home
This home is located at 2755 SW Dilley Rd, Forest Grove, OR 97116 and is currently estimated at $687,960, approximately $360 per square foot. 2755 SW Dilley Rd is a home located in Washington County with nearby schools including Dilley Elementary School, Tom McCall Upper Elementary School, and Neil Armstrong Middle School.
Ownership History
Date
Name
Owned For
Owner Type
Purchase Details
Closed on
Aug 25, 2023
Sold by
Doug And Sarah Marshall Trust
Bought by
Marshall Jacob
Current Estimated Value
Home Financials for this Owner
Home Financials are based on the most recent Mortgage that was taken out on this home.
Original Mortgage
$265,000
Outstanding Balance
$258,875
Interest Rate
6.96%
Mortgage Type
New Conventional
Estimated Equity
$429,085
Purchase Details
Closed on
Feb 6, 2020
Sold by
Marshall Douglas B and Marshall Paige Kenney
Bought by
Marshall Douglas B and Marshall Sarah L
Purchase Details
Closed on
Mar 29, 2006
Sold by
Marshall Wilfred B and Marshall Dolores M
Bought by
Marshall Douglas B and Marshall Paige
Create a Home Valuation Report for This Property
The Home Valuation Report is an in-depth analysis detailing your home's value as well as a comparison with similar homes in the area
Home Values in the Area
Average Home Value in this Area
Purchase History
| Date | Buyer | Sale Price | Title Company |
|---|---|---|---|
| Marshall Jacob | $530,000 | Ticor Title | |
| Marshall Douglas B | -- | None Available | |
| Marshall Douglas B | $35,000 | None Available |
Source: Public Records
Mortgage History
| Date | Status | Borrower | Loan Amount |
|---|---|---|---|
| Open | Marshall Jacob | $265,000 |
Source: Public Records
Tax History Compared to Growth
Tax History
| Year | Tax Paid | Tax Assessment Tax Assessment Total Assessment is a certain percentage of the fair market value that is determined by local assessors to be the total taxable value of land and additions on the property. | Land | Improvement |
|---|---|---|---|---|
| 2026 | $1,538 | $118,690 | -- | -- |
| 2025 | $1,538 | $115,360 | -- | -- |
| 2024 | $1,482 | $112,350 | -- | -- |
| 2023 | $1,482 | $108,990 | $0 | $0 |
| 2022 | $1,280 | $108,990 | $0 | $0 |
| 2021 | $1,273 | $103,190 | $0 | $0 |
| 2020 | $1,278 | $100,310 | $0 | $0 |
| 2019 | $1,247 | $97,520 | $0 | $0 |
| 2018 | $1,228 | $94,800 | $0 | $0 |
| 2017 | $1,197 | $92,170 | $0 | $0 |
| 2016 | $1,166 | $89,600 | $0 | $0 |
| 2015 | $1,090 | $87,120 | $0 | $0 |
| 2014 | $1,060 | $82,570 | $0 | $0 |
Source: Public Records
Map
Nearby Homes
- 2559 SW Dilley Rd
- 44355 SW Plumlee Rd
- 2424 SW Dilley Rd
- 2416 SW Dilley Rd
- 2370 SW Dilley Rd
- 2320 SW Dilley Rd
- 2266 SW Dilley Rd
- 2200 SW Dilley Rd
- 2271 SW Dilley Rd
- 1655 SW Stringtown Rd
- 1561 SW Stringtown Rd
- 43820 SW Hiatt Rd
- 1735 SW Stringtown Rd
- 1493 SW Stringtown Rd
- 1689 SW Stringtown Rd
- 44641 SW Plumlee Rd
- 3400 SW Dilley Rd
- 0 SW Hiatt Rd
- 2018 SW Lavenir Terrace
- 1636 SW Stringtown Rd