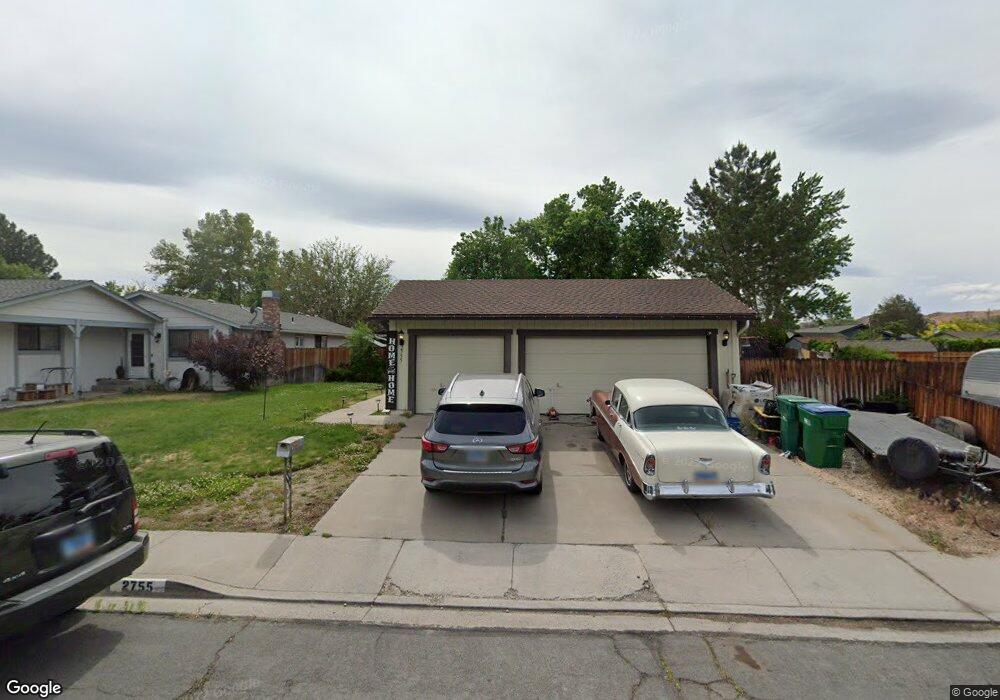
2755 Tallman Rd Sparks, NV 89431
McCarran Boulevard-Probasco NeighborhoodEstimated Value: $401,222 - $444,000
3
Beds
2
Baths
1,264
Sq Ft
$335/Sq Ft
Est. Value
About This Home
This home is located at 2755 Tallman Rd, Sparks, NV 89431 and is currently estimated at $423,056, approximately $334 per square foot. 2755 Tallman Rd is a home located in Washoe County with nearby schools including Florence Drake Elementary School, George L Dilworth Middle School, and Sparks High School.
Ownership History
Date
Name
Owned For
Owner Type
Purchase Details
Closed on
Apr 9, 2008
Sold by
Knight Keith A and Knight Angela N
Bought by
Hunt Janice W and Hunt Robert C
Current Estimated Value
Home Financials for this Owner
Home Financials are based on the most recent Mortgage that was taken out on this home.
Original Mortgage
$176,800
Outstanding Balance
$113,447
Interest Rate
6.22%
Mortgage Type
Unknown
Estimated Equity
$309,609
Purchase Details
Closed on
Dec 5, 2002
Sold by
Salls Mitchell A M and Salls Jennifer Jo
Bought by
Knight Keith A and Knight Angela N
Home Financials for this Owner
Home Financials are based on the most recent Mortgage that was taken out on this home.
Original Mortgage
$137,750
Interest Rate
6.28%
Create a Home Valuation Report for This Property
The Home Valuation Report is an in-depth analysis detailing your home's value as well as a comparison with similar homes in the area
Home Values in the Area
Average Home Value in this Area
Purchase History
| Date | Buyer | Sale Price | Title Company |
|---|---|---|---|
| Hunt Janice W | $221,000 | Western Title Inc Ridge | |
| Knight Keith A | $145,000 | First Centennial Title Co |
Source: Public Records
Mortgage History
| Date | Status | Borrower | Loan Amount |
|---|---|---|---|
| Open | Hunt Janice W | $176,800 | |
| Previous Owner | Knight Keith A | $137,750 |
Source: Public Records
Tax History Compared to Growth
Tax History
| Year | Tax Paid | Tax Assessment Tax Assessment Total Assessment is a certain percentage of the fair market value that is determined by local assessors to be the total taxable value of land and additions on the property. | Land | Improvement |
|---|---|---|---|---|
| 2025 | $1,544 | $67,880 | $38,551 | $29,329 |
| 2024 | $1,500 | $66,680 | $36,493 | $30,187 |
| 2023 | $1,500 | $65,808 | $36,677 | $29,132 |
| 2022 | $1,456 | $54,561 | $29,878 | $24,683 |
| 2021 | $1,415 | $45,629 | $20,617 | $25,012 |
| 2020 | $1,372 | $44,211 | $18,743 | $25,468 |
| 2019 | $1,331 | $44,394 | $19,661 | $24,733 |
| 2018 | $1,293 | $38,785 | $14,222 | $24,563 |
| 2017 | $1,255 | $37,602 | $12,679 | $24,923 |
| 2016 | $1,226 | $37,902 | $12,128 | $25,774 |
| 2015 | $1,227 | $35,930 | $9,886 | $26,044 |
| 2014 | $1,190 | $33,833 | $8,379 | $25,454 |
| 2013 | -- | $31,643 | $6,284 | $25,359 |
Source: Public Records
Map
Nearby Homes
- 3071 Meadowlands Dr
- 3104 Sandy St
- 120 E Lenwood Dr
- 745 Glen Vista Dr
- 10 Sheridan Way
- 3167 Bristle Branch Dr
- 3188 Bristle Branch Dr
- 3198 Bristle Branch Dr
- 3200 Bristle Branch Dr
- 119 Devere Way
- 3245 Elaine Way
- 913 Glen Molly Dr
- 930 Spanish Springs Rd
- 1095 E York Way
- 1051 Glen Martin Dr
- 8 E O St
- 1128 Bradley Square
- 1973 Rio Tinto Dr
- 3595 Rocky Ridge Ct
- 1703 1st St
- 2735 Tallman Rd
- 2790 Patrice Dr
- 365 E Gault Way
- 2750 Patrice Dr
- 2695 Tallman Rd
- 345 E Gault Way
- 2840 Patrice Dr
- 2690 Patrice Dr
- 425 E Gault Way
- 2655 Tallman Rd
- 2690 Tallman Rd
- 2650 Patrice Dr
- 465 E Gault Way
- 2785 Patrice Dr
- 2755 Patrice Dr
- 2595 Tallman Rd
- 2835 Patrice Dr
- 390 E Gault Way Unit 2
- 2650 Tallman Rd
- 2695 Patrice Dr