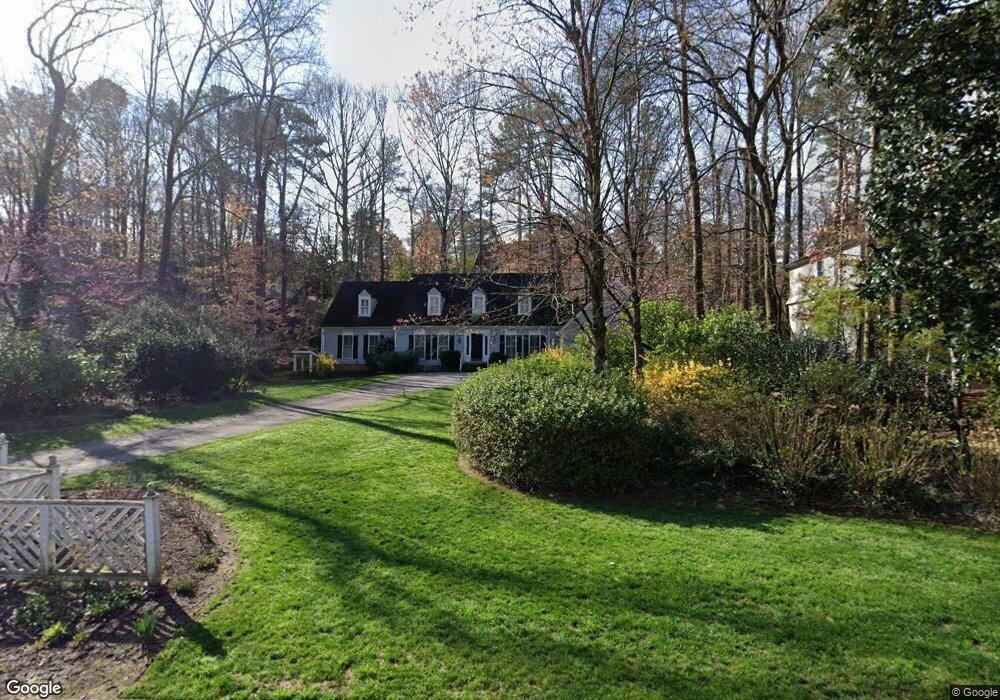
2757 Lansdowne Ln SE Atlanta, GA 30339
Estimated Value: $1,033,671 - $1,426,000
5
Beds
6
Baths
3,906
Sq Ft
$312/Sq Ft
Est. Value
About This Home
This home is located at 2757 Lansdowne Ln SE, Atlanta, GA 30339 and is currently estimated at $1,216,918, approximately $311 per square foot. 2757 Lansdowne Ln SE is a home located in Cobb County with nearby schools including Teasley Elementary School, Campbell Middle School, and Campbell High School.
Ownership History
Date
Name
Owned For
Owner Type
Purchase Details
Closed on
Aug 16, 2011
Sold by
Simmons Bradley W
Bought by
Simmons Bradley W and Simmons Elizabeth C
Current Estimated Value
Purchase Details
Closed on
Aug 20, 2003
Sold by
Simmons Bradley W
Bought by
Simmons Bradley W and Simmons Elizabeth
Home Financials for this Owner
Home Financials are based on the most recent Mortgage that was taken out on this home.
Original Mortgage
$488,000
Interest Rate
4.38%
Mortgage Type
New Conventional
Purchase Details
Closed on
Nov 30, 1993
Sold by
Halvey Micheal C Catherin
Bought by
Simmons Bradley W
Home Financials for this Owner
Home Financials are based on the most recent Mortgage that was taken out on this home.
Original Mortgage
$365,850
Interest Rate
6.85%
Purchase Details
Closed on
Jun 1, 1993
Sold by
Grumann Harold M
Bought by
Halvey Michael C Catherin
Home Financials for this Owner
Home Financials are based on the most recent Mortgage that was taken out on this home.
Original Mortgage
$324,000
Interest Rate
7.39%
Create a Home Valuation Report for This Property
The Home Valuation Report is an in-depth analysis detailing your home's value as well as a comparison with similar homes in the area
Home Values in the Area
Average Home Value in this Area
Purchase History
| Date | Buyer | Sale Price | Title Company |
|---|---|---|---|
| Simmons Bradley W | -- | -- | |
| Simmons Bradley W | -- | -- | |
| Simmons Bradley W | $406,500 | -- | |
| Halvey Michael C Catherin | $360,000 | -- |
Source: Public Records
Mortgage History
| Date | Status | Borrower | Loan Amount |
|---|---|---|---|
| Previous Owner | Simmons Bradley W | $488,000 | |
| Previous Owner | Simmons Bradley W | $365,850 | |
| Previous Owner | Halvey Michael C Catherin | $324,000 |
Source: Public Records
Tax History Compared to Growth
Tax History
| Year | Tax Paid | Tax Assessment Tax Assessment Total Assessment is a certain percentage of the fair market value that is determined by local assessors to be the total taxable value of land and additions on the property. | Land | Improvement |
|---|---|---|---|---|
| 2025 | $2,206 | $353,156 | $160,000 | $193,156 |
| 2024 | $2,213 | $353,156 | $160,000 | $193,156 |
| 2023 | $1,963 | $338,296 | $160,000 | $178,296 |
| 2022 | $2,090 | $311,940 | $160,000 | $151,940 |
| 2021 | $2,090 | $311,940 | $160,000 | $151,940 |
| 2020 | $2,127 | $324,367 | $144,000 | $180,367 |
| 2019 | $2,235 | $360,408 | $160,000 | $200,408 |
| 2018 | $2,164 | $336,716 | $160,000 | $176,716 |
| 2017 | $1,853 | $300,312 | $128,000 | $172,312 |
| 2016 | $1,869 | $300,312 | $128,000 | $172,312 |
| 2015 | $2,007 | $300,312 | $128,000 | $172,312 |
| 2014 | $1,781 | $223,512 | $0 | $0 |
Source: Public Records
Map
Nearby Homes
- 2792 Lansdowne Ln SE
- 4101 Brookview Dr SE
- 4421 Paradise Cir SE
- 4408 Brookview Dr SE
- 4201 Brookview Dr SE
- 4412 Brookview Dr SE
- 4395 Woodland Brook Dr SE
- 4320 Brookview Dr SE
- 4432 Brookview Dr SE
- 4503 Atley Woods Dr SE
- 4100 Paces Walk SE Unit 2104
- 4100 Paces Walk SE Unit 1306
- 4100 Paces Walk SE Unit 1305
- 4100 Paces Walk SE Unit 1303
- 4100 Paces Walk SE Unit 2304
- 4100 Paces Walk SE Unit 3205
- 4100 Paces Walk SE Unit 2205
- 3099 Farmington Dr SE
- 3733 Allegretto Cir
- 2423 Figaro Dr
- 2747 Lansdowne Ln SE
- 2767 Lansdowne Ln SE
- 4291 N Elizabeth Ln SE
- 4281 N Elizabeth Ln SE
- 2737 Lansdowne Ln SE
- 4301 N Elizabeth Ln SE
- 2777 Lansdowne Ln SE
- 2742 Lansdowne Ln SE
- 2752 Lansdowne Ln SE
- 4271 N Elizabeth Ln SE
- 2722 Lansdowne Ln SE
- 2772 Lansdowne Ln SE
- 2727 Lansdowne Ln SE
- 4260 Lansdowne Dr SE
- 4261 N Elizabeth Ln SE
- 4300 N Elizabeth Ln SE
- 4286 N Elizabeth Ln SE
- 2787 Lansdowne Ln SE
- 4276 N Elizabeth Ln SE
- 4210 Lansdowne Drive S E