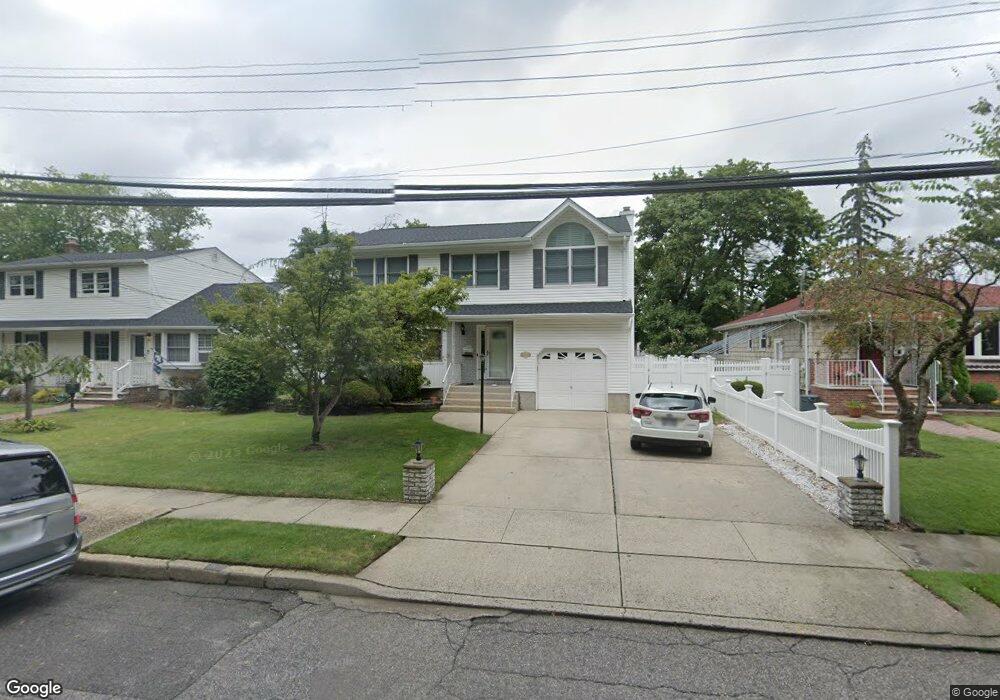
2757 Preston Place North Bellmore, NY 11710
Estimated Value: $795,487 - $839,000
--
Bed
3
Baths
1,964
Sq Ft
$416/Sq Ft
Est. Value
About This Home
This home is located at 2757 Preston Place, North Bellmore, NY 11710 and is currently estimated at $817,244, approximately $416 per square foot. 2757 Preston Place is a home located in Nassau County with nearby schools including Weatherford West Elementary School, Lt. General Thomas P. Stafford Elementary School, and Grand Avenue Middle School.
Ownership History
Date
Name
Owned For
Owner Type
Purchase Details
Closed on
May 21, 2013
Sold by
Marder Eric D and Marder Pamela L
Bought by
Marder Eric D and Marder Pamela L
Current Estimated Value
Home Financials for this Owner
Home Financials are based on the most recent Mortgage that was taken out on this home.
Original Mortgage
$388,000
Outstanding Balance
$80,740
Interest Rate
2.66%
Estimated Equity
$736,504
Purchase Details
Closed on
Mar 1, 2007
Sold by
Gorman Sean
Bought by
Marder Eric
Purchase Details
Closed on
Mar 30, 2005
Sold by
Gurino Lawrence
Bought by
Gorman Sean
Purchase Details
Closed on
Jun 28, 2002
Sold by
Terra Home Construction C
Bought by
Gurino Lawrence
Purchase Details
Closed on
Nov 7, 2001
Sold by
Lupo Joseph B
Bought by
Terra Homes Construction Corp
Create a Home Valuation Report for This Property
The Home Valuation Report is an in-depth analysis detailing your home's value as well as a comparison with similar homes in the area
Home Values in the Area
Average Home Value in this Area
Purchase History
| Date | Buyer | Sale Price | Title Company |
|---|---|---|---|
| Marder Eric D | -- | -- | |
| Marder Eric | $585,000 | -- | |
| Gorman Sean | $590,000 | -- | |
| Gurino Lawrence | $430,000 | -- | |
| Terra Homes Construction Corp | $200,000 | Harold L Rosenthal |
Source: Public Records
Mortgage History
| Date | Status | Borrower | Loan Amount |
|---|---|---|---|
| Open | Marder Eric D | $388,000 |
Source: Public Records
Tax History Compared to Growth
Tax History
| Year | Tax Paid | Tax Assessment Tax Assessment Total Assessment is a certain percentage of the fair market value that is determined by local assessors to be the total taxable value of land and additions on the property. | Land | Improvement |
|---|---|---|---|---|
| 2025 | $13,745 | $518 | $159 | $359 |
| 2024 | $3,587 | $514 | $158 | $356 |
| 2023 | $11,582 | $535 | $164 | $371 |
| 2022 | $11,582 | $535 | $164 | $371 |
| 2021 | $14,513 | $612 | $188 | $424 |
| 2020 | $13,497 | $786 | $485 | $301 |
| 2019 | $12,942 | $842 | $489 | $353 |
| 2018 | $13,074 | $859 | $0 | $0 |
| 2017 | $8,562 | $913 | $466 | $447 |
| 2016 | $12,634 | $1,019 | $520 | $499 |
| 2015 | $4,213 | $1,019 | $520 | $499 |
| 2014 | $4,213 | $1,019 | $520 | $499 |
| 2013 | $3,953 | $1,019 | $520 | $499 |
Source: Public Records
Map
Nearby Homes
- 2758 Mayfield Place
- 886 Bellmore Ave
- 930 W Shelley Rd
- 899 Brent Dr
- 2846 Walter Rd
- 985 Douglas Ave
- 736 Bellmore Rd
- 2906 Lawrence Dr
- 1010 Brent Dr
- 2548 Columbus Ave
- 980 Siems Ct
- 2794 Janet Ave
- 646 Evelyn Ave
- 2986 Valley Rd
- 2477 Columbus Ave
- 875 Woodside Dr
- 732 Woodside Dr
- 975 Little Neck Ave
- 858 Mayer Dr
- 375 Loring Rd
- 2761 Preston Place
- 2751 Preston Place
- 2769 Preston Place
- 2754 Ravine Place
- 2760 Ravine Place
- 885 Midwood Dr
- 2766 Ravine Place
- 2748 Ravine Place
- 893 Midwood Dr
- 2772 Ravine Place
- 875 Midwood Dr
- 2787 Preston Place
- 2751 Ravine Place
- 2786 Ravine Place
- 2757 Ravine Place
- 869 Midwood Dr
- 888 Midwood Dr
- 880 Midwood Dr
- 2769 Ravine Place