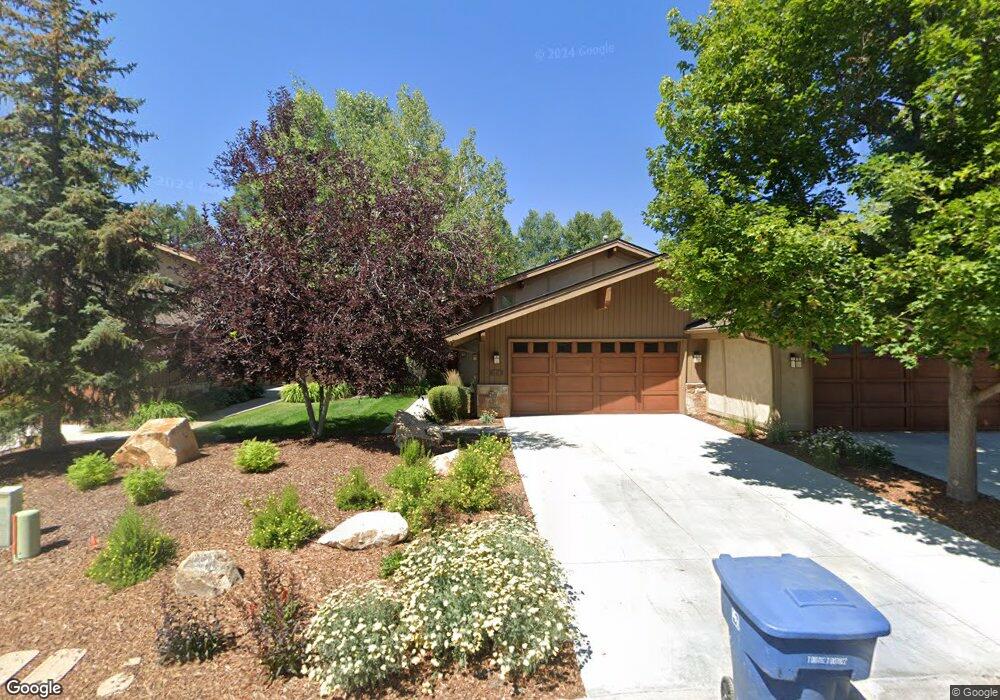
2758 Estates Dr Unit 27B Park City, UT 84060
Estimated Value: $1,922,000 - $2,482,964
3
Beds
3
Baths
2,200
Sq Ft
$1,013/Sq Ft
Est. Value
About This Home
This home is located at 2758 Estates Dr Unit 27B, Park City, UT 84060 and is currently estimated at $2,227,741, approximately $1,012 per square foot. 2758 Estates Dr Unit 27B is a home located in Summit County with nearby schools including McPolin Elementary School, Treasure Mountain Junior High School, and Ecker Hill Middle School.
Ownership History
Date
Name
Owned For
Owner Type
Purchase Details
Closed on
Aug 9, 2023
Sold by
2758 Estates Llc
Bought by
Lubanko Stephen and Lubanko Kelley
Current Estimated Value
Purchase Details
Closed on
Jun 30, 2020
Sold by
Northpoint Properties Lc
Bought by
2758 Estates Llc
Purchase Details
Closed on
Nov 26, 2018
Sold by
Mcjames Susan H
Bought by
Northpointe Properties Llc
Purchase Details
Closed on
May 6, 2014
Sold by
Mciames Susan H
Bought by
Mcjames Susan H and The Susan H Mcjames Trust
Purchase Details
Closed on
Apr 9, 2014
Sold by
Mcjames Scott W
Bought by
Mcjames Susan H
Purchase Details
Closed on
Sep 28, 2005
Sold by
Esty Donna M
Bought by
Mcjames Scott W and Mcjames Susan H
Home Financials for this Owner
Home Financials are based on the most recent Mortgage that was taken out on this home.
Original Mortgage
$201,000
Interest Rate
5.72%
Mortgage Type
New Conventional
Create a Home Valuation Report for This Property
The Home Valuation Report is an in-depth analysis detailing your home's value as well as a comparison with similar homes in the area
Home Values in the Area
Average Home Value in this Area
Purchase History
| Date | Buyer | Sale Price | Title Company |
|---|---|---|---|
| Lubanko Stephen | -- | Real Advantage Title Insurance | |
| 2758 Estates Llc | -- | Real Advantage Ttl Ins Agcy | |
| Northpointe Properties Llc | -- | First American Title | |
| Mcjames Susan H | -- | None Available | |
| Mcjames Susan H | -- | None Available | |
| Mcjames Scott W | -- | Us Title |
Source: Public Records
Mortgage History
| Date | Status | Borrower | Loan Amount |
|---|---|---|---|
| Previous Owner | Mcjames Scott W | $201,000 |
Source: Public Records
Tax History Compared to Growth
Tax History
| Year | Tax Paid | Tax Assessment Tax Assessment Total Assessment is a certain percentage of the fair market value that is determined by local assessors to be the total taxable value of land and additions on the property. | Land | Improvement |
|---|---|---|---|---|
| 2024 | $3,189 | $591,993 | $302,500 | $289,493 |
| 2023 | $3,189 | $565,675 | $302,500 | $263,175 |
| 2022 | $3,569 | $541,750 | $302,500 | $239,250 |
| 2021 | $3,562 | $467,500 | $302,500 | $165,000 |
| 2020 | $3,782 | $467,500 | $302,500 | $165,000 |
| 2019 | $3,848 | $850,000 | $550,000 | $300,000 |
| 2018 | $3,848 | $467,500 | $302,500 | $165,000 |
| 2017 | $3,871 | $495,000 | $330,000 | $165,000 |
| 2016 | $4,750 | $591,250 | $330,000 | $261,250 |
| 2015 | $4,781 | $563,750 | $0 | $0 |
| 2013 | $3,177 | $349,250 | $0 | $0 |
Source: Public Records
Map
Nearby Homes
- 6 Saint Andrews Ct
- 5 Augusta Ct
- 125 Yonex Ct
- 2053 Evening Star Dr
- 40 Spaulding Ct
- 3021 American Saddler Dr
- 2903 Sunny Slopes Ct
- 2867 Lucky John Dr
- 2548 Fairway Village Dr
- 1911 Evening Star Dr
- 1211 Little Kate Rd Unit 73
- 2830 Holiday Ranch Loop Rd
- 2634 Cove Ct
- 1396 Moray Ct
- 1860 Lucky John Dr
- 1830 Lucky John Dr
- 1830 Lucky John Dr Unit 90
- 3041 Oak Rim Ln
- 3065 Oak Rim Ln
- 858 Red Maple Ct
- 2758 Estates Dr
- 2756 Estates Dr
- 2756 Estates Dr Unit 2756
- 2756 Estates Dr Unit 27-A
- 2762 Estates Dr
- 2762 Estates Dr Unit 2762
- 2762 Estates Dr Unit 28B
- 2764 Estates Dr
- 2764 Estates Dr Unit 28A
- 2768 Estates Dr
- 2768 Estates Dr Unit 2768
- 2768 Estates Dr Unit 29A
- 2770 Estates Dr
- 2770 Estates Dr Unit 29B
- 2748 Four Lakes Dr
- 2761 Estates Dr
- 2761 Estates Dr Unit 2761
- 2761 Estates Dr Unit 25A
- 2746 Four Lakes Dr
- 2746 Four Lakes Dr Unit 2B