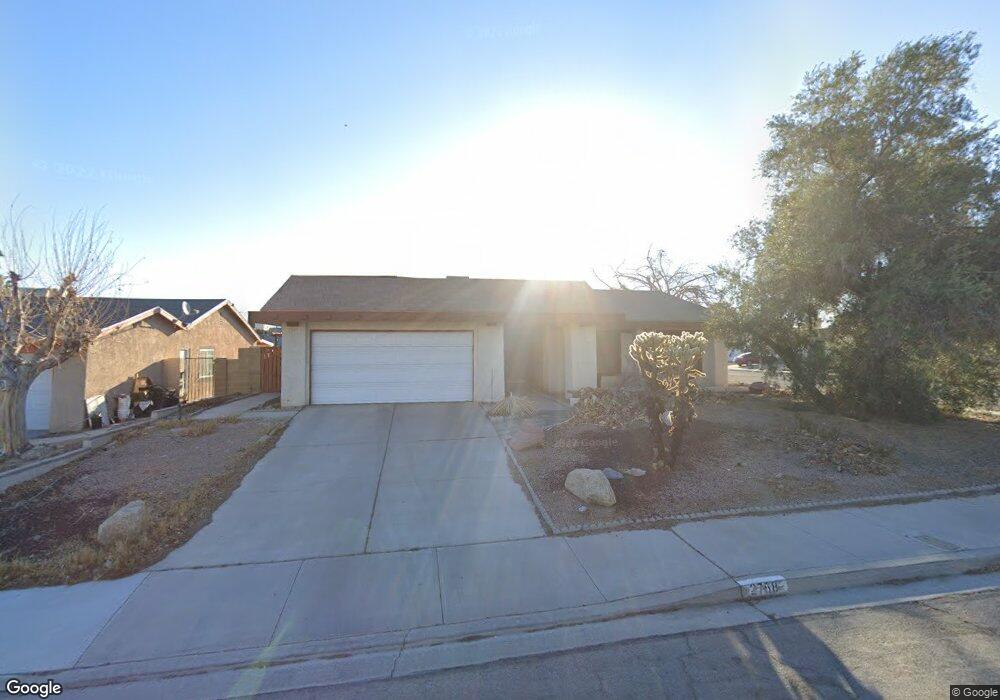
2758 Polar Ct Las Vegas, NV 89121
Estimated Value: $354,000 - $457,000
3
Beds
2
Baths
1,672
Sq Ft
$236/Sq Ft
Est. Value
About This Home
This home is located at 2758 Polar Ct, Las Vegas, NV 89121 and is currently estimated at $394,885, approximately $236 per square foot. 2758 Polar Ct is a home located in Clark County with nearby schools including Will Beckley Elementary School, Knudson Academy of the Arts, and Valley High School.
Ownership History
Date
Name
Owned For
Owner Type
Purchase Details
Closed on
Jul 23, 2001
Sold by
Duarte Ruben and Deduarte Valdes
Bought by
Duarte Ruben and Valdes Deduarte Manuela
Current Estimated Value
Home Financials for this Owner
Home Financials are based on the most recent Mortgage that was taken out on this home.
Original Mortgage
$123,728
Outstanding Balance
$47,716
Interest Rate
7.15%
Mortgage Type
FHA
Estimated Equity
$347,169
Purchase Details
Closed on
May 19, 2000
Sold by
Mule Philip R and Mule Susan A
Bought by
Duarte Ruben and Deduarte Valdes
Home Financials for this Owner
Home Financials are based on the most recent Mortgage that was taken out on this home.
Original Mortgage
$120,757
Interest Rate
8.18%
Mortgage Type
FHA
Purchase Details
Closed on
Oct 4, 1994
Sold by
Beach James Leonard and Beach Tamara
Bought by
Mule Philip R and Mule Susan A
Create a Home Valuation Report for This Property
The Home Valuation Report is an in-depth analysis detailing your home's value as well as a comparison with similar homes in the area
Home Values in the Area
Average Home Value in this Area
Purchase History
| Date | Buyer | Sale Price | Title Company |
|---|---|---|---|
| Duarte Ruben | -- | United Title | |
| Duarte Ruben | $121,000 | Old Republic Title Company | |
| Mule Philip R | $115,000 | First American Title Company |
Source: Public Records
Mortgage History
| Date | Status | Borrower | Loan Amount |
|---|---|---|---|
| Open | Duarte Ruben | $123,728 | |
| Closed | Duarte Ruben | $120,757 |
Source: Public Records
Tax History Compared to Growth
Tax History
| Year | Tax Paid | Tax Assessment Tax Assessment Total Assessment is a certain percentage of the fair market value that is determined by local assessors to be the total taxable value of land and additions on the property. | Land | Improvement |
|---|---|---|---|---|
| 2025 | $1,282 | $54,212 | $28,000 | $26,212 |
| 2024 | $1,187 | $54,212 | $28,000 | $26,212 |
| 2023 | $1,187 | $56,984 | $33,250 | $23,734 |
| 2022 | $1,100 | $49,187 | $28,000 | $21,187 |
| 2021 | $1,018 | $45,024 | $24,150 | $20,874 |
| 2020 | $943 | $45,510 | $24,150 | $21,360 |
| 2019 | $884 | $41,314 | $19,600 | $21,714 |
| 2018 | $843 | $38,707 | $17,150 | $21,557 |
| 2017 | $1,109 | $37,828 | $15,400 | $22,428 |
| 2016 | $790 | $32,682 | $9,100 | $23,582 |
| 2015 | $788 | $32,937 | $9,100 | $23,837 |
| 2014 | $765 | $25,296 | $6,300 | $18,996 |
Source: Public Records
Map
Nearby Homes
- 2759 Long Ct
- 2680 Karen Ave
- 2657 Kline Cir
- 2909 Pacific Ave
- 2471 Old Forge Ln Unit 105
- 2659 Vegas Valley Dr
- 2451 Old Forge Ln Unit 105
- 2761 Phoenix St
- 2460 Old Forge Ln Unit 48
- 2430 Old Forge Ln Unit 106
- 2420 Old Forge Ln Unit 104
- 2432 Palma Vista Ave
- 3030 Liberty Cir N
- 2491 Capistrano Ave
- 0 Robar St Unit 2718009
- 2346 Capistrano Ave
- 3056 Ocotillo Ct
- 3080 Garnet Ct
- 3105 Vegas Valley Dr
- 2825 Burnham Ave