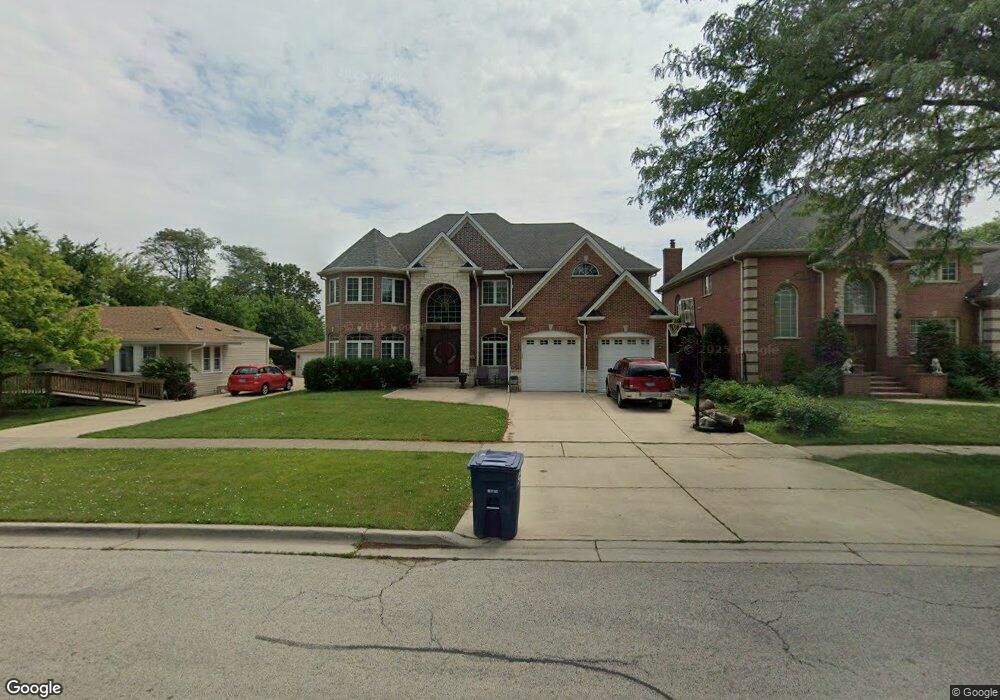
2759 S Scott St Des Plaines, IL 60018
Estimated Value: $729,000 - $1,067,000
5
Beds
4
Baths
4,700
Sq Ft
$190/Sq Ft
Est. Value
About This Home
This home is located at 2759 S Scott St, Des Plaines, IL 60018 and is currently estimated at $891,771, approximately $189 per square foot. 2759 S Scott St is a home located in Cook County with nearby schools including Orchard Place Elementary School, Algonquin Middle School, and Maine West High School.
Ownership History
Date
Name
Owned For
Owner Type
Purchase Details
Closed on
Dec 27, 2012
Sold by
Gonzalez Cuillermo
Bought by
Gonzalez Ramirez Lilia and Gonzalez Ramirez Lilia
Current Estimated Value
Purchase Details
Closed on
Jun 16, 2011
Sold by
Indymac Venture Llc
Bought by
Gonzalez Guillermo
Purchase Details
Closed on
Apr 5, 2011
Sold by
Berinde Gina R
Bought by
Indymac Venture Llc
Purchase Details
Closed on
Aug 5, 2005
Sold by
Fiarito Ann T
Bought by
Berinde Gina R
Home Financials for this Owner
Home Financials are based on the most recent Mortgage that was taken out on this home.
Original Mortgage
$200,900
Interest Rate
5.75%
Mortgage Type
Fannie Mae Freddie Mac
Purchase Details
Closed on
Jan 31, 1995
Sold by
Fiarito Frank R
Bought by
Fiarito Ann T
Create a Home Valuation Report for This Property
The Home Valuation Report is an in-depth analysis detailing your home's value as well as a comparison with similar homes in the area
Home Values in the Area
Average Home Value in this Area
Purchase History
| Date | Buyer | Sale Price | Title Company |
|---|---|---|---|
| Gonzalez Ramirez Lilia | -- | None Available | |
| Gonzalez Guillermo | $352,000 | None Available | |
| Indymac Venture Llc | -- | None Available | |
| Berinde Gina R | $287,000 | First American Title | |
| Fiarito Ann T | -- | -- |
Source: Public Records
Mortgage History
| Date | Status | Borrower | Loan Amount |
|---|---|---|---|
| Previous Owner | Berinde Gina R | $200,900 |
Source: Public Records
Tax History Compared to Growth
Tax History
| Year | Tax Paid | Tax Assessment Tax Assessment Total Assessment is a certain percentage of the fair market value that is determined by local assessors to be the total taxable value of land and additions on the property. | Land | Improvement |
|---|---|---|---|---|
| 2024 | $17,318 | $69,000 | $10,871 | $58,129 |
| 2023 | $16,874 | $69,000 | $10,871 | $58,129 |
| 2022 | $16,874 | $69,000 | $10,871 | $58,129 |
| 2021 | $16,433 | $56,791 | $9,059 | $47,732 |
| 2020 | $16,224 | $56,791 | $9,059 | $47,732 |
| 2019 | $16,250 | $63,811 | $9,059 | $54,752 |
| 2018 | $16,635 | $59,057 | $7,972 | $51,085 |
| 2017 | $16,358 | $59,057 | $7,972 | $51,085 |
| 2016 | $15,717 | $59,057 | $7,972 | $51,085 |
| 2015 | $13,608 | $47,636 | $6,885 | $40,751 |
| 2014 | $13,337 | $47,636 | $6,885 | $40,751 |
| 2013 | $12,988 | $47,636 | $6,885 | $40,751 |
Source: Public Records
Map
Nearby Homes
- 2609 Eisenhower Dr
- 2945 S Scott St
- 2600 S Scott St
- 2126 David Dr
- 1966 Laura Ln
- 2993 Curtis St Unit C41
- 2993 Curtis St
- 2646 Maple St
- 1757 Farwell Ave
- 3051 S Scott St
- 2500 Maple St
- 38 E Touhy Ave
- 1706 Buckingham Dr
- 1641 E Touhy Ave
- 1629 E Touhy Ave
- 200 Thames Pkwy Unit 1
- 201 Thames Pkwy Unit 2F
- 400 Ascot Dr Unit 3M
- 2400 Archbury Ln Unit 2
- 2300 Windsor Mall Unit 1F
- 2775 S Scott St
- 2753 S Scott St
- 2745 S Scott St
- 2014 Pratt Ave
- 2785 S Scott St
- 2024 Pratt Ave
- 2754 Joseph Ave
- 2746 Joseph Ave
- 2735 S Scott St
- 2034 Pratt Ave
- 2740 Joseph Ave
- 2727 S Scott St
- 2766 S Scott St
- 2043 Fox Ln
- 2756 S Scott St
- 2734 Joseph Ave
- 2044 Pratt Ave
- 2811 S Scott St
- 2748 S Scott St
- 2782 S Scott St Unit 3