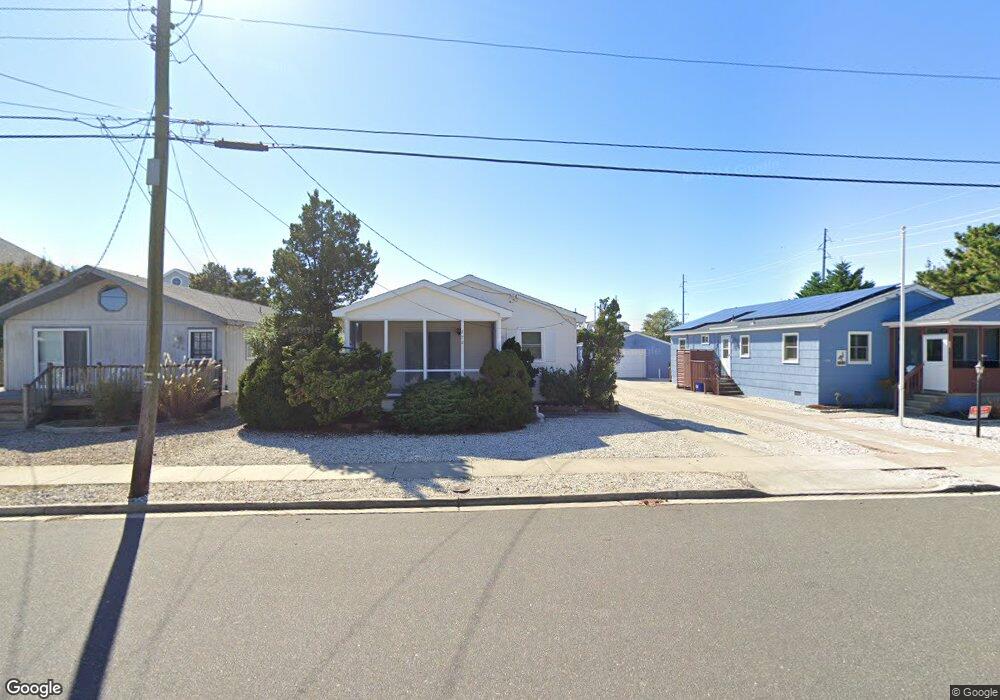
276 42nd St Avalon, NJ 08202
Estimated Value: $2,073,762 - $2,915,000
Studio
--
Bath
1,144
Sq Ft
$2,235/Sq Ft
Est. Value
About This Home
This home is located at 276 42nd St, Avalon, NJ 08202 and is currently estimated at $2,556,441, approximately $2,234 per square foot. 276 42nd St is a home located in Cape May County with nearby schools including Avalon Elementary School.
Ownership History
Date
Name
Owned For
Owner Type
Purchase Details
Closed on
Aug 15, 2013
Sold by
Smith Kathryn A
Bought by
Smith Kathryn A and Smith Eric S
Current Estimated Value
Purchase Details
Closed on
Apr 27, 2011
Sold by
Schmid Robert
Bought by
Smith Kathryn A
Purchase Details
Closed on
Jul 20, 2009
Sold by
Schmid Robert
Bought by
Smith Kathryn A
Purchase Details
Closed on
Jul 6, 2004
Sold by
Schmid Barbara S
Bought by
Schmid Robert
Purchase Details
Closed on
Jul 7, 1992
Sold by
Schmid Barbara S
Bought by
Schmid Barbara S
Purchase Details
Closed on
Aug 9, 1989
Sold by
Schmid Barbara
Bought by
Schmid Barbara
Create a Home Valuation Report for This Property
The Home Valuation Report is an in-depth analysis detailing your home's value as well as a comparison with similar homes in the area
Home Values in the Area
Average Home Value in this Area
Purchase History
| Date | Buyer | Sale Price | Title Company |
|---|---|---|---|
| Smith Kathryn A | -- | None Available | |
| Smith Kathryn A | -- | None Available | |
| Smith Kathryn A | -- | None Available | |
| Schmid Robert | -- | -- | |
| Schmid Robert | -- | -- | |
| Schmid Barbara S | -- | -- | |
| Schmid Barbara | $14,000 | -- |
Source: Public Records
Tax History
| Year | Tax Paid | Tax Assessment Tax Assessment Total Assessment is a certain percentage of the fair market value that is determined by local assessors to be the total taxable value of land and additions on the property. | Land | Improvement |
|---|---|---|---|---|
| 2025 | $5,933 | $966,300 | $950,000 | $16,300 |
| 2024 | $5,933 | $966,300 | $950,000 | $16,300 |
| 2023 | $5,885 | $966,300 | $950,000 | $16,300 |
| 2022 | $5,286 | $966,300 | $950,000 | $16,300 |
| 2021 | $4,928 | $966,300 | $950,000 | $16,300 |
| 2020 | $5,083 | $966,300 | $950,000 | $16,300 |
| 2019 | $4,928 | $966,300 | $950,000 | $16,300 |
| 2018 | $4,716 | $966,300 | $950,000 | $16,300 |
| 2017 | $3,939 | $708,500 | $687,500 | $21,000 |
| 2016 | $3,897 | $708,500 | $687,500 | $21,000 |
| 2015 | $3,833 | $708,500 | $687,500 | $21,000 |
| 2014 | $3,790 | $708,500 | $687,500 | $21,000 |
Source: Public Records
Map
Nearby Homes
- 256 42nd St
- 264 41st St
- 198 40th St
- 4640 Ocean Dr
- 4610 4th Ave
- 253 35th St Unit WEST
- 3429 Dune Dr
- 162 33rd St
- 173 33rd St Unit 3
- 158 32nd St
- 179 32nd St
- 3149 First Ave
- 55 32nd St W Unit C2B
- 55 32nd St W
- 55 32nd St W Unit 1A
- 25 32nd St W
- 2934 Ocean Dr Unit North
- 5499 Dune Dr
- 2988 1st Ave
- 2928 Ocean Dr Unit C-N
Your Personal Tour Guide
Ask me questions while you tour the home.