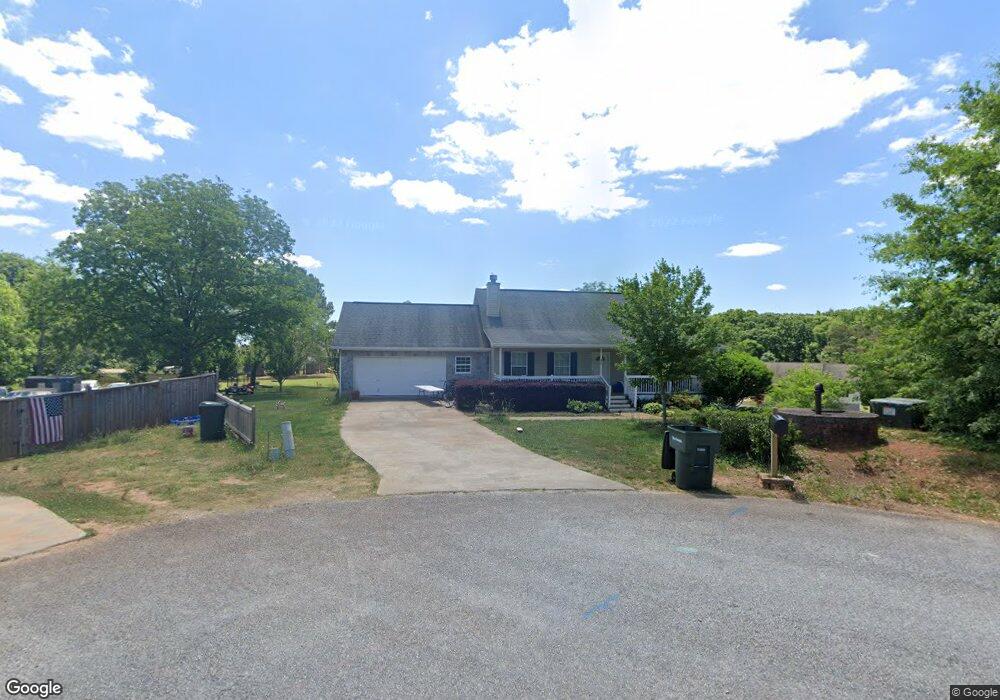
276 Arbor Gates Dr Cornelia, GA 30531
Estimated Value: $260,764 - $318,000
3
Beds
2
Baths
1,178
Sq Ft
$240/Sq Ft
Est. Value
About This Home
This home is located at 276 Arbor Gates Dr, Cornelia, GA 30531 and is currently estimated at $283,191, approximately $240 per square foot. 276 Arbor Gates Dr is a home located in Habersham County with nearby schools including Cornelia Elementary School, Habersham Success Academy, and Wilbanks Middle School.
Ownership History
Date
Name
Owned For
Owner Type
Purchase Details
Closed on
Aug 12, 2025
Sold by
Miguel Michael
Bought by
Johnson Kay L and Johnson Lury J
Current Estimated Value
Home Financials for this Owner
Home Financials are based on the most recent Mortgage that was taken out on this home.
Original Mortgage
$115,000
Outstanding Balance
$114,602
Interest Rate
5.92%
Mortgage Type
New Conventional
Estimated Equity
$168,589
Purchase Details
Closed on
Dec 28, 2011
Sold by
Land John Wales
Bought by
Miguel Michael
Purchase Details
Closed on
Sep 3, 2010
Sold by
Hsbc Mtg Svcs Inc
Bought by
Land John Wales
Purchase Details
Closed on
May 31, 2005
Sold by
Woods Dynamics Inc
Bought by
Sinlapakone Keooudone and Thammavong Bouavanh
Home Financials for this Owner
Home Financials are based on the most recent Mortgage that was taken out on this home.
Original Mortgage
$120,900
Interest Rate
8.99%
Mortgage Type
New Conventional
Create a Home Valuation Report for This Property
The Home Valuation Report is an in-depth analysis detailing your home's value as well as a comparison with similar homes in the area
Home Values in the Area
Average Home Value in this Area
Purchase History
| Date | Buyer | Sale Price | Title Company |
|---|---|---|---|
| Johnson Kay L | $275,000 | -- | |
| Miguel Michael | $79,000 | -- | |
| Land John Wales | $68,900 | -- | |
| Sinlapakone Keooudone | $126,900 | -- |
Source: Public Records
Mortgage History
| Date | Status | Borrower | Loan Amount |
|---|---|---|---|
| Open | Johnson Kay L | $115,000 | |
| Previous Owner | Sinlapakone Keooudone | $120,900 |
Source: Public Records
Tax History Compared to Growth
Tax History
| Year | Tax Paid | Tax Assessment Tax Assessment Total Assessment is a certain percentage of the fair market value that is determined by local assessors to be the total taxable value of land and additions on the property. | Land | Improvement |
|---|---|---|---|---|
| 2025 | $2,275 | $106,068 | $12,000 | $94,068 |
| 2024 | -- | $82,520 | $8,000 | $74,520 |
| 2023 | $696 | $69,576 | $8,000 | $61,576 |
| 2022 | $1,086 | $60,784 | $8,000 | $52,784 |
| 2021 | $1,040 | $55,068 | $8,000 | $47,068 |
| 2020 | $822 | $36,668 | $3,200 | $33,468 |
| 2019 | $823 | $36,668 | $3,200 | $33,468 |
| 2018 | $819 | $36,668 | $3,200 | $33,468 |
| 2017 | $783 | $33,780 | $3,200 | $30,580 |
| 2016 | $756 | $84,450 | $3,200 | $30,580 |
| 2015 | $749 | $84,450 | $3,200 | $30,580 |
| 2014 | $752 | $82,560 | $3,200 | $29,824 |
| 2013 | -- | $31,600 | $5,000 | $26,600 |
Source: Public Records
Map
Nearby Homes
- 0 Chase Rd Unit 10658099
- 292 Chenocetah Dr
- 240 Sugar Maple Dr
- 600 Elrod St
- 296 Grand Ave
- 133 Hillandale St
- 227 Short Ave
- 266 Short Ave
- 530 Grandview Ave
- 820 Camp Creek Rd
- 952 Wayside St NW
- 283 Yonah St
- 175 Hillcrest St
- 134 Hillcrest St
- 795 Wayside St
- 16.8AC Camp Creek Rd
- 1576 Chase Rd
- 600 Hoyt St
- 142 Galloway St
- 113 Foster St NW
- 184 Arbor Gates Dr
- 275 Arbor Gates Dr
- 170 Arbor Gates Dr Unit 18
- 170 Arbor Gates Dr
- 268 Arbor Gates Dr
- 196 Arbor Gates Dr
- 269 Arbor Gates Dr
- 162 Arbor Gates Dr
- 187 Arbor Gates Dr
- 216 Arbor Gates Dr
- 244 Arbor Gates Dr
- 175 Arbor Gates Dr
- 199 Arbor Gates Dr
- 215 Arbor Gates Dr
- 266 Arbor Gates Dr
- 251 Dewitt Hill Dr
- 156 Fox Hollow Rd
- 156 Fox Hollow Rd Unit 23
- 163 Arbor Gates Dr
- 163 Arbor Gates Dr Unit 2