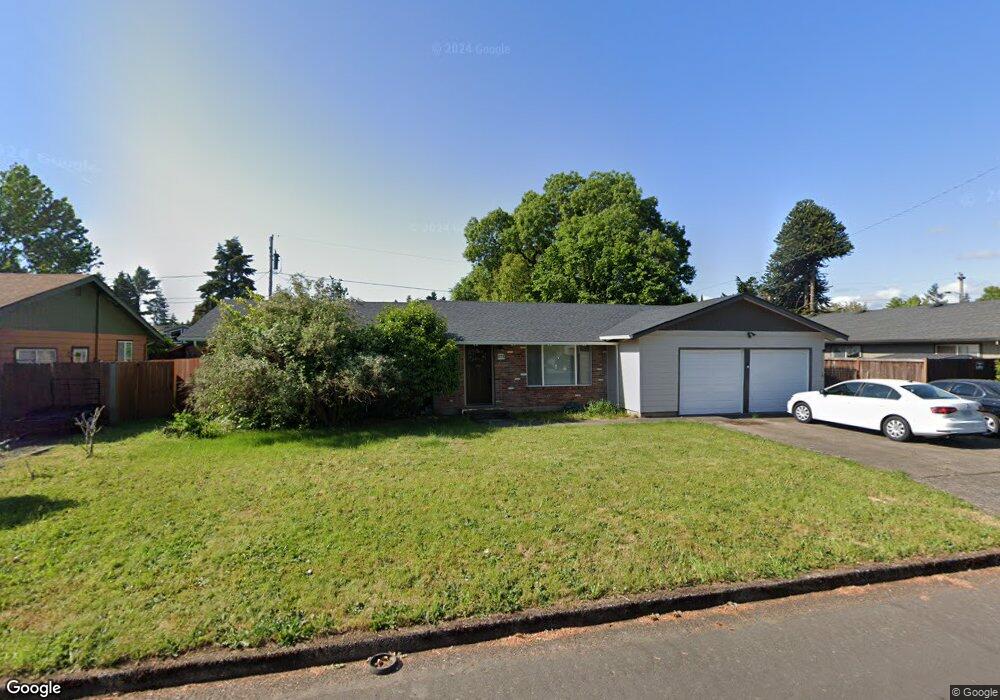
276 Blackfoot Ave Eugene, OR 97404
Santa Clara NeighborhoodEstimated Value: $412,000 - $477,000
3
Beds
2
Baths
1,508
Sq Ft
$291/Sq Ft
Est. Value
About This Home
This home is located at 276 Blackfoot Ave, Eugene, OR 97404 and is currently estimated at $438,818, approximately $290 per square foot. 276 Blackfoot Ave is a home located in Lane County with nearby schools including Spring Creek Elementary School, Madison Middle School, and North Eugene High School.
Ownership History
Date
Name
Owned For
Owner Type
Purchase Details
Closed on
Feb 22, 2021
Sold by
Roberts Stacey M
Bought by
Roberts Stacey Michelle and Anderson Joshua Cameron
Current Estimated Value
Home Financials for this Owner
Home Financials are based on the most recent Mortgage that was taken out on this home.
Original Mortgage
$58,000
Outstanding Balance
$51,756
Interest Rate
2.7%
Mortgage Type
New Conventional
Estimated Equity
$387,062
Create a Home Valuation Report for This Property
The Home Valuation Report is an in-depth analysis detailing your home's value as well as a comparison with similar homes in the area
Home Values in the Area
Average Home Value in this Area
Purchase History
We collect this data history from publicly available records. To have your information removed, we recommend requesting removal directly through your county’s website.
| Date | Buyer | Sale Price | Title Company |
|---|---|---|---|
| Roberts Stacey Michelle | -- | Cascade Title Co |
Source: Public Records
Mortgage History
We collect this data history from publicly available records. To have your information removed, we recommend requesting removal directly through your county’s website.
| Date | Status | Borrower | Loan Amount |
|---|---|---|---|
| Open | Roberts Stacey Michelle | $58,000 |
Source: Public Records
Tax History
| Year | Tax Paid | Tax Assessment Tax Assessment Total Assessment is a certain percentage of the fair market value that is determined by local assessors to be the total taxable value of land and additions on the property. | Land | Improvement |
|---|---|---|---|---|
| 2025 | $3,050 | $238,345 | -- | -- |
| 2024 | $3,035 | $231,403 | -- | -- |
| 2023 | $3,035 | $224,664 | $0 | $0 |
| 2022 | $2,852 | $218,121 | $0 | $0 |
| 2021 | $2,617 | $211,768 | $0 | $0 |
| 2020 | $2,666 | $205,600 | $0 | $0 |
| 2019 | $2,554 | $199,612 | $0 | $0 |
| 2018 | $2,317 | $188,154 | $0 | $0 |
| 2017 | $2,125 | $188,154 | $0 | $0 |
| 2016 | $1,992 | $182,674 | $0 | $0 |
| 2015 | $1,910 | $177,353 | $0 | $0 |
| 2014 | $1,785 | $172,187 | $0 | $0 |
Source: Public Records
Map
Nearby Homes
- 3240 Cindy St
- 178 Terra Linda Ave
- 3565 Castrey St
- 328 Dean Ave
- 2996 River Rd
- 230 River Loop 2
- 346 River Loop 1
- 141 Cortland Ln
- 190 River Loop 1
- 2995 Camrose St
- 355 River Loop 2
- 987 Travis Ave
- 2721 La Darrah St
- 3513 Kendra St
- 3625 Kendra St
- 3653 Willowbrook St
- 571 River Loop 2
- 4173 Shannon St
- 683 Terra Linda Ave
- 3820 Kendra St
- 260 Blackfoot Ave
- 298 Blackfoot Ave
- 275 Knight Ave
- 3373 Palace St
- 251 Knight Ave
- 265 Blackfoot Ave
- 232 Blackfoot Ave
- 229 Knight Ave
- 233 Blackfoot Ave
- 316 Blackfoot Ave
- 3380 Palace St
- 198 Blackfoot Ave
- 276 Knight Ave
- 160 W Anchor Ave
- 298 Knight Ave
- 240 Knight Ave
- 198 W Anchor Ave
- 120 W Anchor Ave
- 321 Blackfoot Ave
- 197 Knight Ave
Your Personal Tour Guide
Ask me questions while you tour the home.