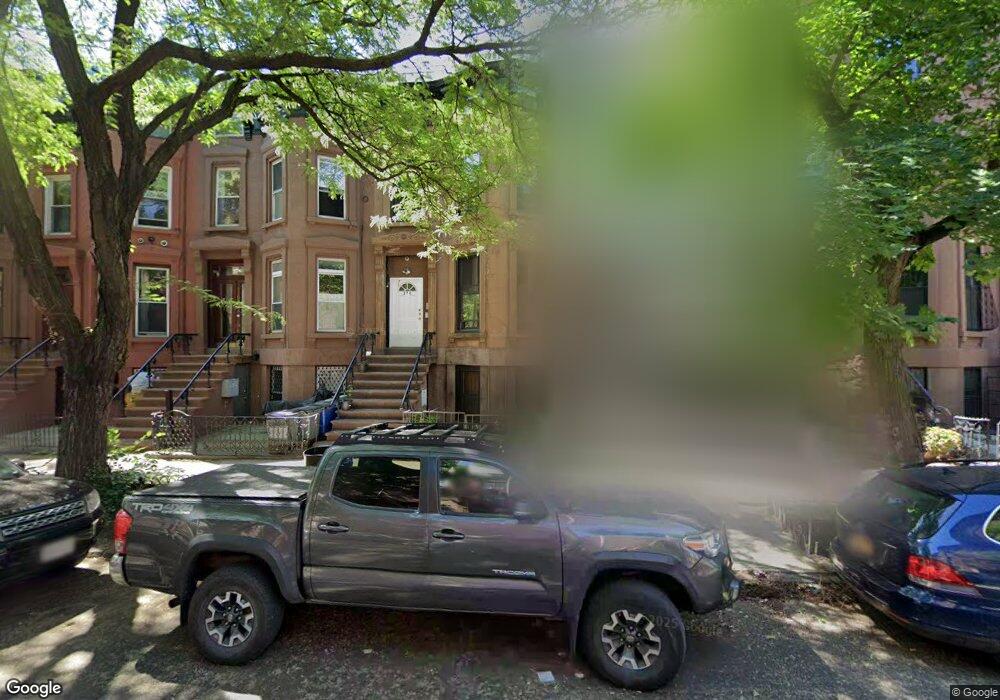
276 Clifton Place Unit 1-B Brooklyn, NY 11216
Bed-Stuy NeighborhoodEstimated Value: $1,437,000 - $2,418,000
1
Bed
1
Bath
2,520
Sq Ft
$740/Sq Ft
Est. Value
About This Home
This home is located at 276 Clifton Place Unit 1-B, Brooklyn, NY 11216 and is currently estimated at $1,863,667, approximately $739 per square foot. 276 Clifton Place Unit 1-B is a home located in Kings County with nearby schools including P.S. 256 Benjamin Banneker Magnet School of Architecture and Engineering, Brooklyn Academy High School, and Talmud Torah Dnitra.
Ownership History
Date
Name
Owned For
Owner Type
Purchase Details
Closed on
May 12, 2009
Sold by
Kutty Nisha
Bought by
Richman Al-Khabir
Current Estimated Value
Home Financials for this Owner
Home Financials are based on the most recent Mortgage that was taken out on this home.
Original Mortgage
$483,312
Interest Rate
5.03%
Mortgage Type
Purchase Money Mortgage
Purchase Details
Closed on
May 29, 2007
Sold by
Richman Al-Khabir
Bought by
Kutty Nisha and Richman Al-Khabir
Purchase Details
Closed on
Jul 21, 1998
Sold by
Alliance Development Corp
Bought by
Gonzalez Musette and Richman Al Khabir
Purchase Details
Closed on
Nov 19, 1996
Sold by
Howard Sethina T
Bought by
Alliance Development Corp
Create a Home Valuation Report for This Property
The Home Valuation Report is an in-depth analysis detailing your home's value as well as a comparison with similar homes in the area
Home Values in the Area
Average Home Value in this Area
Purchase History
| Date | Buyer | Sale Price | Title Company |
|---|---|---|---|
| Richman Al-Khabir | -- | -- | |
| Kutty Nisha | -- | -- | |
| Gonzalez Musette | $239,000 | Commonwealth Land Title Ins | |
| Alliance Development Corp | $30,500 | -- |
Source: Public Records
Mortgage History
| Date | Status | Borrower | Loan Amount |
|---|---|---|---|
| Previous Owner | Richman Al-Khabir | $483,312 |
Source: Public Records
Tax History Compared to Growth
Tax History
| Year | Tax Paid | Tax Assessment Tax Assessment Total Assessment is a certain percentage of the fair market value that is determined by local assessors to be the total taxable value of land and additions on the property. | Land | Improvement |
|---|---|---|---|---|
| 2025 | $4,842 | $103,920 | $15,180 | $88,740 |
| 2024 | $4,842 | $92,160 | $15,180 | $76,980 |
| 2023 | $4,856 | $97,620 | $15,180 | $82,440 |
| 2022 | $4,480 | $106,980 | $15,180 | $91,800 |
| 2021 | $4,445 | $103,020 | $15,180 | $87,840 |
| 2020 | $2,076 | $124,920 | $15,180 | $109,740 |
| 2019 | $4,153 | $109,560 | $15,180 | $94,380 |
| 2018 | $4,002 | $21,093 | $3,463 | $17,630 |
| 2017 | $3,757 | $19,900 | $5,153 | $14,747 |
| 2016 | $3,443 | $18,775 | $5,037 | $13,738 |
| 2015 | $2,045 | $17,713 | $5,586 | $12,127 |
| 2014 | $2,045 | $17,713 | $5,507 | $12,206 |
Source: Public Records
Map
Nearby Homes
- 548 Lafayette Ave Unit 2
- 406 Greene Ave Unit 3
- 235 Lexington Ave
- 190 Lexington Ave
- 173 Quincy St
- 376 Greene Ave
- 196 Clifton Place
- 327 Franklin Ave
- 452 Lafayette Ave Unit 4B
- 335 Franklin Ave
- 610 Dekalb Ave Unit 4
- 337 Nostrand Ave Unit 301B
- 315 Gates Ave Unit 3
- 358 Gates Ave
- 347 Greene Ave Unit 4C
- 276A Quincy St Unit A
- 292 Gates Ave
- 114 Lexington Ave Unit 203
- 1142 Bedford Ave Unit 4F
- 149 Clifton Place Unit 3
- 276 Clifton Place
- 274 Clifton Place
- 274 Clifton Place Unit Top Floor
- 274 Clifton Place Unit 3
- 278 Clifton Place
- 278 Clifton Place Unit 3
- 278 Clifton Place Unit 1
- 278 Clifton Place Unit 2
- 272 Clifton Place Unit 1
- 272 Clifton Place Unit 3
- 272 Clifton Place
- 272 Clifton Place
- 272 Clifton Place
- 280 Clifton Place
- 280 Clifton Place Unit 2nd Fl
- 280 Clifton Place Unit 3
- 280 Clifton Place Unit 2NDFLOOR
- 270 Clifton Place
- 282 Clifton Place
- 282 Clifton Place Unit 2