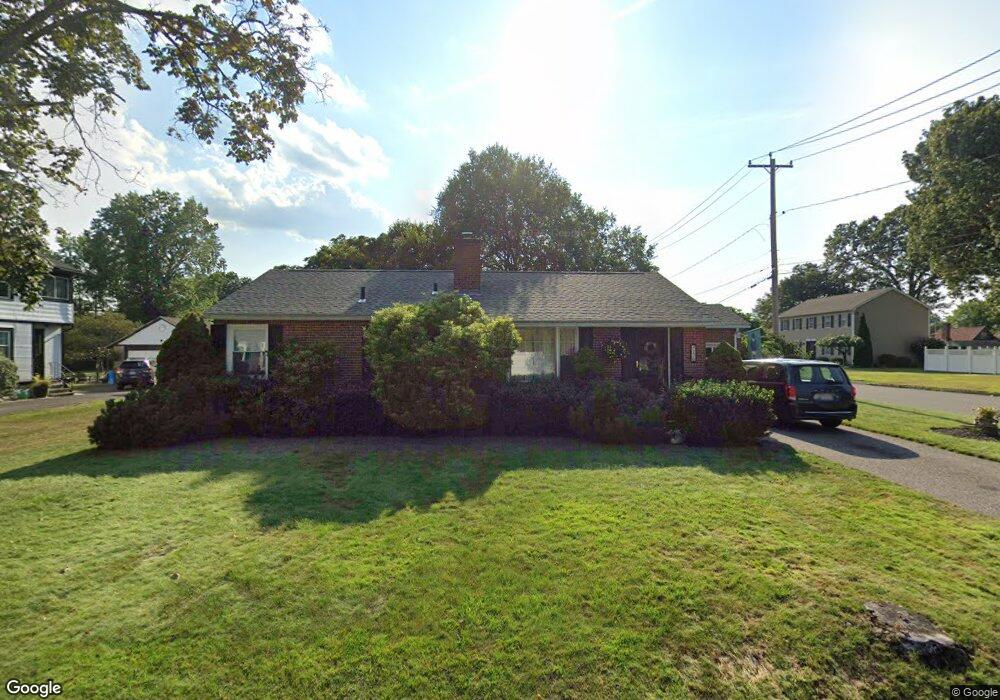
276 Moore St Chicopee, MA 01013
Chicopee Center NeighborhoodEstimated Value: $291,000 - $342,000
2
Beds
2
Baths
1,260
Sq Ft
$252/Sq Ft
Est. Value
About This Home
This home is located at 276 Moore St, Chicopee, MA 01013 and is currently estimated at $317,197, approximately $251 per square foot. 276 Moore St is a home located in Hampden County with nearby schools including Bowe Elementary School, Fairview Middle School, and Chicopee High School.
Ownership History
Date
Name
Owned For
Owner Type
Purchase Details
Closed on
Jun 24, 1999
Sold by
Lefleur Robert D and Lafleur Doreen M
Bought by
Livingstone Donald and Livingstone Carol A
Current Estimated Value
Home Financials for this Owner
Home Financials are based on the most recent Mortgage that was taken out on this home.
Original Mortgage
$97,850
Outstanding Balance
$25,891
Interest Rate
7.09%
Mortgage Type
Purchase Money Mortgage
Estimated Equity
$291,306
Purchase Details
Closed on
Dec 13, 1996
Sold by
Kelly Helen C Est
Bought by
Lafleur Robert D and Lafleur Doreen M
Home Financials for this Owner
Home Financials are based on the most recent Mortgage that was taken out on this home.
Original Mortgage
$95,000
Interest Rate
7.75%
Mortgage Type
Purchase Money Mortgage
Create a Home Valuation Report for This Property
The Home Valuation Report is an in-depth analysis detailing your home's value as well as a comparison with similar homes in the area
Home Values in the Area
Average Home Value in this Area
Purchase History
| Date | Buyer | Sale Price | Title Company |
|---|---|---|---|
| Livingstone Donald | $103,000 | -- | |
| Lafleur Robert D | $100,000 | -- |
Source: Public Records
Mortgage History
| Date | Status | Borrower | Loan Amount |
|---|---|---|---|
| Open | Lafleur Robert D | $97,850 | |
| Previous Owner | Lafleur Robert D | $95,000 |
Source: Public Records
Tax History
| Year | Tax Paid | Tax Assessment Tax Assessment Total Assessment is a certain percentage of the fair market value that is determined by local assessors to be the total taxable value of land and additions on the property. | Land | Improvement |
|---|---|---|---|---|
| 2025 | $3,958 | $261,100 | $94,400 | $166,700 |
| 2024 | $3,753 | $254,300 | $92,500 | $161,800 |
| 2023 | $3,488 | $230,200 | $84,100 | $146,100 |
| 2022 | $3,400 | $200,100 | $73,100 | $127,000 |
| 2021 | $3,231 | $183,500 | $66,500 | $117,000 |
| 2020 | $3,073 | $176,000 | $66,500 | $109,500 |
| 2019 | $3,026 | $168,500 | $66,500 | $102,000 |
| 2018 | $0 | $161,500 | $63,300 | $98,200 |
| 2017 | $2,714 | $156,800 | $63,300 | $93,500 |
| 2016 | $2,562 | $151,500 | $63,300 | $88,200 |
| 2015 | $2,838 | $161,800 | $63,300 | $98,500 |
| 2014 | $1,419 | $161,800 | $63,300 | $98,500 |
Source: Public Records
Map
Nearby Homes
- 1078 Liberty St
- 61 Abbey Memorial Dr Unit 153
- 2 Marion St
- Lot 1 Marion St
- 85 Orchard St
- 248 Hampden St
- 491-493 Newbury St
- 15 Hyde Ave
- 118 Wait St
- 121 Wait St
- 59 Piedmont St
- 27 Parallel St
- 744-746 Carew St
- 708-710 Carew St
- 774-776 Liberty St
- 69 Beston St
- 13 Beston St
- 119 Littleton St
- 571-573 Carew St
- 27 Abbey St
Your Personal Tour Guide
Ask me questions while you tour the home.