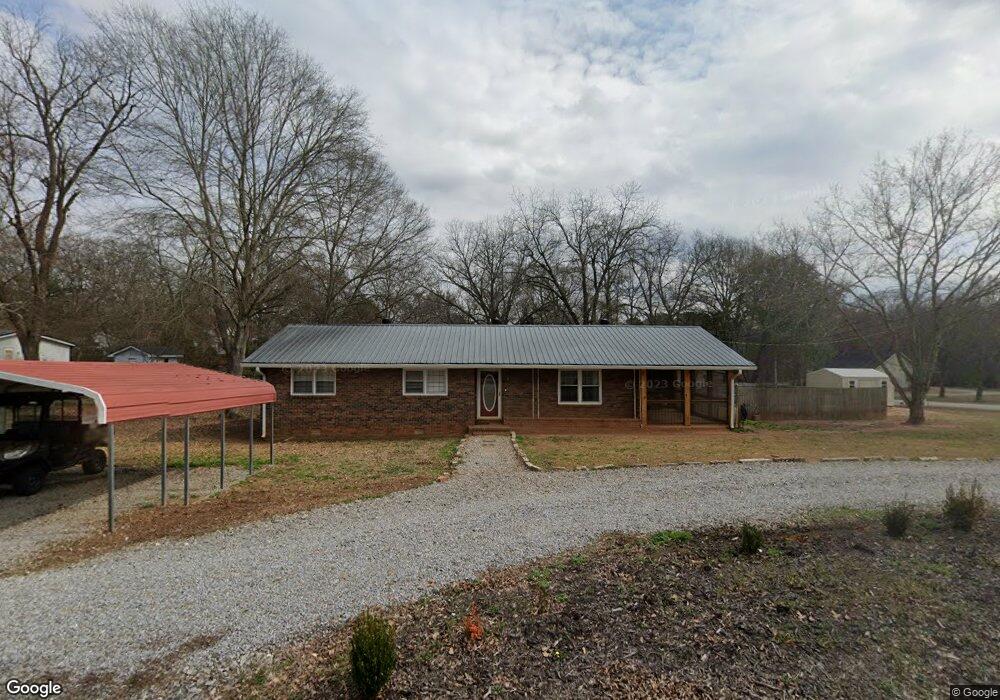
276 Mulberry St Nicholson, GA 30565
Estimated Value: $174,000 - $248,000
--
Bed
1
Bath
1,291
Sq Ft
$162/Sq Ft
Est. Value
About This Home
This home is located at 276 Mulberry St, Nicholson, GA 30565 and is currently estimated at $209,161, approximately $162 per square foot. 276 Mulberry St is a home with nearby schools including East Jackson Elementary School, Satilla Elementary School, and East Jackson Middle School.
Ownership History
Date
Name
Owned For
Owner Type
Purchase Details
Closed on
Dec 9, 2019
Sold by
Kesler Kevin Mason
Bought by
Kesler Joshua Aaron and Kesler Jazmin Carolina
Current Estimated Value
Home Financials for this Owner
Home Financials are based on the most recent Mortgage that was taken out on this home.
Original Mortgage
$81,000
Outstanding Balance
$71,413
Interest Rate
3.6%
Mortgage Type
New Conventional
Estimated Equity
$137,748
Purchase Details
Closed on
Dec 21, 2016
Sold by
Claudine Mcclure
Bought by
Kesler Amy Leann and Kesler Kevin Mason
Home Financials for this Owner
Home Financials are based on the most recent Mortgage that was taken out on this home.
Original Mortgage
$64,865
Interest Rate
3.87%
Mortgage Type
FHA
Purchase Details
Closed on
Oct 5, 2016
Sold by
James Mason
Bought by
Kesler Claudine Mcclure
Create a Home Valuation Report for This Property
The Home Valuation Report is an in-depth analysis detailing your home's value as well as a comparison with similar homes in the area
Home Values in the Area
Average Home Value in this Area
Purchase History
| Date | Buyer | Sale Price | Title Company |
|---|---|---|---|
| Kesler Joshua Aaron | $108,000 | -- | |
| Kesler Kevin Mason | -- | -- | |
| Kesler Amy Leann | $75,000 | -- | |
| Kesler Claudine Mcclure | -- | -- |
Source: Public Records
Mortgage History
| Date | Status | Borrower | Loan Amount |
|---|---|---|---|
| Open | Kesler Kevin Mason | $81,000 | |
| Closed | Kesler Joshua Aaron | $81,000 | |
| Previous Owner | Kesler Amy Leann | $64,865 |
Source: Public Records
Tax History Compared to Growth
Tax History
| Year | Tax Paid | Tax Assessment Tax Assessment Total Assessment is a certain percentage of the fair market value that is determined by local assessors to be the total taxable value of land and additions on the property. | Land | Improvement |
|---|---|---|---|---|
| 2024 | $1,330 | $49,360 | $5,320 | $44,040 |
| 2023 | $1,330 | $44,188 | $5,320 | $38,868 |
| 2022 | $1,131 | $37,188 | $5,320 | $31,868 |
| 2021 | $1,135 | $37,588 | $5,320 | $32,268 |
| 2020 | $1,070 | $32,388 | $5,320 | $27,068 |
| 2019 | $1,029 | $32,388 | $5,320 | $27,068 |
| 2018 | $1,097 | $34,124 | $5,320 | $28,804 |
| 2017 | $1,020 | $31,621 | $5,354 | $26,267 |
| 2016 | $331 | $31,621 | $5,354 | $26,267 |
| 2015 | $333 | $31,621 | $5,354 | $26,267 |
| 2014 | $280 | $28,747 | $5,354 | $23,393 |
| 2013 | -- | $29,171 | $5,354 | $23,817 |
Source: Public Records
Map
Nearby Homes
- 5111 U S 441
- 5246 Us-441 S
- 0 Birch St Unit 7627498
- 620 Ivy Creek Dr
- 573 Sanford Dr
- 0 Jefferson Dr Unit 7635823
- 0 Jefferson Dr Unit 10588928
- 24 Quail Ridge Dr
- 5044 U S 441
- 698 Ivy Creek Dr
- 0 Berea Rd Unit 10622565
- 334 Summit Heights Dr
- 301 Summit Heights Dr
- 192 Plantation Crossing
- 520 Old Athens Dr
- 410 Wilson Cemetery Rd
- 719 Old Athens Dr
- 750 Staghorn Trail
- 3319 U S 441
- 7 Red Rose Rd