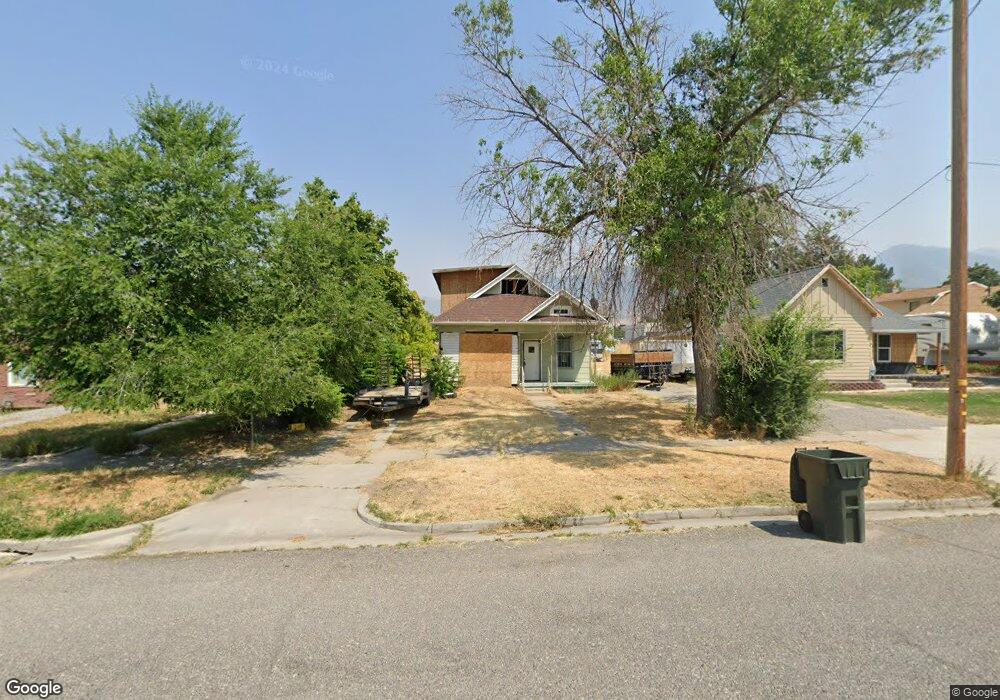
276 N 100 W Tooele, UT 84074
Estimated Value: $187,000 - $317,000
3
Beds
2
Baths
1,950
Sq Ft
$125/Sq Ft
Est. Value
About This Home
This home is located at 276 N 100 W, Tooele, UT 84074 and is currently estimated at $243,483, approximately $124 per square foot. 276 N 100 W is a home located in Tooele County with nearby schools including Northlake Elementary School, Tooele Junior High School, and Tooele High School.
Ownership History
Date
Name
Owned For
Owner Type
Purchase Details
Closed on
Sep 5, 2024
Sold by
Salt Lake Warrior Llc
Bought by
Redoux Industries Llc
Current Estimated Value
Purchase Details
Closed on
Sep 4, 2024
Sold by
Sierra-West Properties Llc
Bought by
Salt Lake Warrior Llc
Purchase Details
Closed on
May 20, 2024
Sold by
Tiffany Lancaster Real Estate Inc
Bought by
Sierra-West Properties Llc
Purchase Details
Closed on
Aug 31, 2020
Sold by
Jensen Joshua B and Jensen Debra K
Bought by
Tiffany Lancaster Real Estate Inc
Home Financials for this Owner
Home Financials are based on the most recent Mortgage that was taken out on this home.
Original Mortgage
$127,000
Interest Rate
2.9%
Mortgage Type
Commercial
Purchase Details
Closed on
Aug 14, 2017
Sold by
Pulliam Thomas A
Bought by
Jensen Joshua B and Jensen Debra K
Create a Home Valuation Report for This Property
The Home Valuation Report is an in-depth analysis detailing your home's value as well as a comparison with similar homes in the area
Home Values in the Area
Average Home Value in this Area
Purchase History
| Date | Buyer | Sale Price | Title Company |
|---|---|---|---|
| Redoux Industries Llc | -- | None Listed On Document | |
| Salt Lake Warrior Llc | -- | Gt Title Services | |
| Sierra-West Properties Llc | -- | Gt Title Services | |
| Tiffany Lancaster Real Estate Inc | -- | Metro National Title | |
| Jensen Joshua B | -- | Inwest Title | |
| Pulliman Thomas A | -- | Inwest Title Services Inc |
Source: Public Records
Mortgage History
| Date | Status | Borrower | Loan Amount |
|---|---|---|---|
| Previous Owner | Tiffany Lancaster Real Estate Inc | $127,000 |
Source: Public Records
Tax History Compared to Growth
Tax History
| Year | Tax Paid | Tax Assessment Tax Assessment Total Assessment is a certain percentage of the fair market value that is determined by local assessors to be the total taxable value of land and additions on the property. | Land | Improvement |
|---|---|---|---|---|
| 2025 | $1,061 | $88,472 | $86,100 | $2,372 |
| 2024 | $1,160 | $88,562 | $86,100 | $2,462 |
| 2023 | $1,160 | $103,256 | $83,726 | $19,530 |
| 2022 | $731 | $62,865 | $55,440 | $7,425 |
| 2021 | $590 | $42,460 | $36,960 | $5,500 |
| 2020 | $392 | $48,875 | $38,875 | $10,000 |
| 2019 | $118 | $144,760 | $38,875 | $105,885 |
| 2018 | $1,134 | $132,074 | $40,000 | $92,074 |
| 2017 | $717 | $99,107 | $31,250 | $67,857 |
| 2016 | $619 | $49,641 | $17,188 | $32,453 |
| 2015 | $619 | $45,026 | $0 | $0 |
| 2014 | -- | $45,026 | $0 | $0 |
Source: Public Records
Map
Nearby Homes