276 N 8th St Mifflinburg, PA 17844
Estimated Value: $138,000 - $198,000
3
Beds
1
Bath
952
Sq Ft
$174/Sq Ft
Est. Value
About This Home
This home is located at 276 N 8th St, Mifflinburg, PA 17844 and is currently estimated at $165,431, approximately $173 per square foot. 276 N 8th St is a home located in Union County with nearby schools including Mifflinburg Elementary School, Mifflinburg Area Intermediate School, and Mifflinburg Area Middle School.
Ownership History
Date
Name
Owned For
Owner Type
Purchase Details
Closed on
Sep 13, 2021
Sold by
Kapp Brian and Kapp Tina
Bought by
Martin Loren S
Current Estimated Value
Purchase Details
Closed on
Oct 27, 2011
Sold by
Bowersox Carl D and Bowersox Karen G
Bought by
Shipton Anthony J and Shipton Lindsey E
Home Financials for this Owner
Home Financials are based on the most recent Mortgage that was taken out on this home.
Original Mortgage
$32,000
Interest Rate
4.08%
Mortgage Type
Purchase Money Mortgage
Create a Home Valuation Report for This Property
The Home Valuation Report is an in-depth analysis detailing your home's value as well as a comparison with similar homes in the area
Home Values in the Area
Average Home Value in this Area
Purchase History
| Date | Buyer | Sale Price | Title Company |
|---|---|---|---|
| Martin Loren S | $98,900 | -- | |
| Shipton Anthony J | $40,000 | None Available |
Source: Public Records
Mortgage History
| Date | Status | Borrower | Loan Amount |
|---|---|---|---|
| Previous Owner | Shipton Anthony J | $32,000 |
Source: Public Records
Tax History Compared to Growth
Tax History
| Year | Tax Paid | Tax Assessment Tax Assessment Total Assessment is a certain percentage of the fair market value that is determined by local assessors to be the total taxable value of land and additions on the property. | Land | Improvement |
|---|---|---|---|---|
| 2025 | $1,115 | $56,300 | $30,800 | $25,500 |
| 2024 | $1,115 | $56,300 | $30,800 | $25,500 |
| 2023 | $1,078 | $56,300 | $30,800 | $25,500 |
| 2022 | $1,073 | $56,300 | $30,800 | $25,500 |
| 2021 | $1,063 | $56,300 | $30,800 | $25,500 |
| 2020 | $1,038 | $56,300 | $30,800 | $25,500 |
| 2019 | $1,018 | $56,300 | $30,800 | $25,500 |
| 2018 | $996 | $56,300 | $30,800 | $25,500 |
| 2017 | $975 | $56,300 | $30,800 | $25,500 |
| 2016 | $924 | $56,300 | $30,800 | $25,500 |
| 2015 | -- | $56,300 | $30,800 | $25,500 |
| 2014 | -- | $56,300 | $30,800 | $25,500 |
Source: Public Records
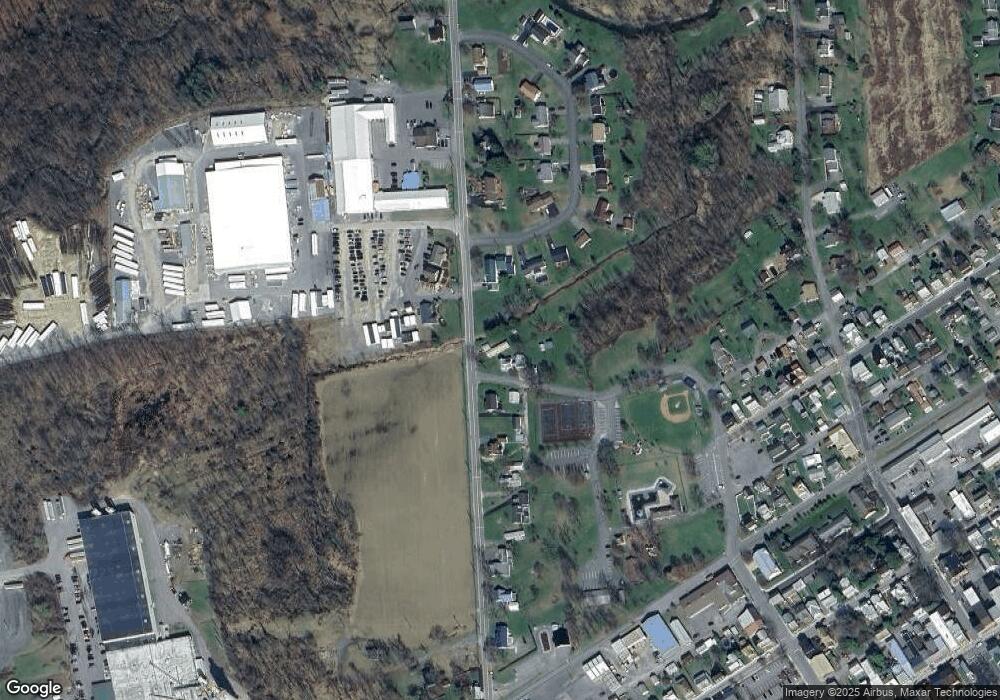
Map
Nearby Homes