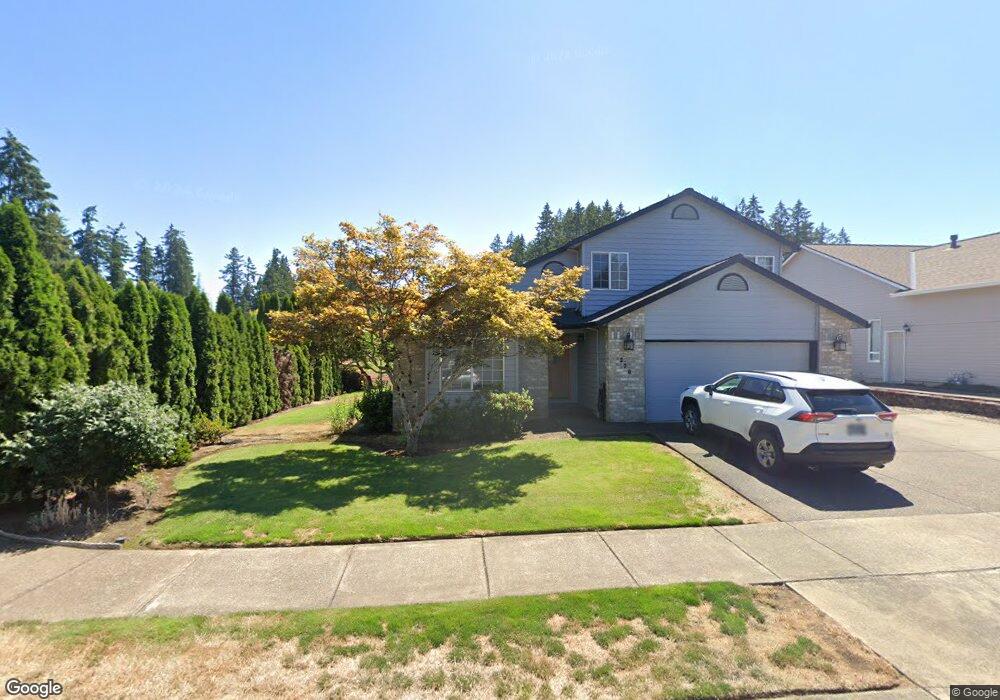
276 NE Treena St Hillsboro, OR 97124
Northwest Hillsboro NeighborhoodEstimated Value: $589,000 - $646,000
4
Beds
3
Baths
2,051
Sq Ft
$302/Sq Ft
Est. Value
About This Home
This home is located at 276 NE Treena St, Hillsboro, OR 97124 and is currently estimated at $619,600, approximately $302 per square foot. 276 NE Treena St is a home located in Washington County with nearby schools including Paul L. Patterson Elementary School, Evergreen Jr High School, and Glencoe High School.
Ownership History
Date
Name
Owned For
Owner Type
Purchase Details
Closed on
Sep 2, 2016
Sold by
Dahlberg Bjorn M and Dahlberg Gloria C
Bought by
Mishler Jennifer L and Mishler Troy S
Current Estimated Value
Home Financials for this Owner
Home Financials are based on the most recent Mortgage that was taken out on this home.
Original Mortgage
$380,000
Outstanding Balance
$304,016
Interest Rate
3.48%
Mortgage Type
New Conventional
Estimated Equity
$315,584
Purchase Details
Closed on
May 3, 2013
Sold by
Hagen Lori L
Bought by
Dahlberg Bjorn M and Dahlberg Gloria C
Purchase Details
Closed on
Apr 15, 1998
Sold by
Jay Miller Builder Inc
Bought by
Hagen David L and Hagen Lori L
Home Financials for this Owner
Home Financials are based on the most recent Mortgage that was taken out on this home.
Original Mortgage
$182,600
Interest Rate
7.06%
Purchase Details
Closed on
Feb 26, 1997
Sold by
Meacham Meadows Ii Partners Llc
Bought by
Jay Miller Builder Inc
Create a Home Valuation Report for This Property
The Home Valuation Report is an in-depth analysis detailing your home's value as well as a comparison with similar homes in the area
Home Values in the Area
Average Home Value in this Area
Purchase History
| Date | Buyer | Sale Price | Title Company |
|---|---|---|---|
| Mishler Jennifer L | $400,000 | First American | |
| Dahlberg Bjorn M | $324,500 | First American | |
| Hagen David L | $202,900 | Chicago Title Insurance Co | |
| Jay Miller Builder Inc | $58,000 | Fidelity National Title Co |
Source: Public Records
Mortgage History
| Date | Status | Borrower | Loan Amount |
|---|---|---|---|
| Open | Mishler Jennifer L | $380,000 | |
| Previous Owner | Hagen David L | $182,600 |
Source: Public Records
Tax History Compared to Growth
Tax History
| Year | Tax Paid | Tax Assessment Tax Assessment Total Assessment is a certain percentage of the fair market value that is determined by local assessors to be the total taxable value of land and additions on the property. | Land | Improvement |
|---|---|---|---|---|
| 2025 | $5,318 | $325,340 | -- | -- |
| 2024 | $5,167 | $315,870 | -- | -- |
| 2023 | $5,167 | $306,670 | $0 | $0 |
| 2022 | $5,027 | $306,670 | $0 | $0 |
| 2021 | $4,925 | $289,070 | $0 | $0 |
| 2020 | $4,819 | $280,660 | $0 | $0 |
| 2019 | $4,681 | $272,490 | $0 | $0 |
| 2018 | $4,481 | $264,560 | $0 | $0 |
| 2017 | $4,318 | $256,860 | $0 | $0 |
| 2016 | $4,200 | $249,380 | $0 | $0 |
| 2015 | $4,031 | $242,120 | $0 | $0 |
| 2014 | $4,008 | $235,070 | $0 | $0 |
Source: Public Records
Map
Nearby Homes
- 2643 NE 2nd Dr
- 2878 NE Aurora Dr
- 175 NE Chancellor Ct
- 3166 NE Glencoe Oaks Place
- 2795 NE Lorie Dr
- 2011 NE Josephine Dr
- 234 NE Shannon St
- 3215 NE 4th Ave
- 1676 NE 2nd Ave
- 3968 NW 3rd Ave
- 729 NE Rogahn St
- 555 NW Hertel St
- 1706 NW 8th Ave
- 1756 NW 9th Ave
- 1560 NW 6th Ave
- 528 NW Celtis Ln
- 1425 NE Glen Ellen Dr
- 1900 NE Harewood Place
- 795 NE Rogahn St
- 807 NW Brookhill St
- 272 NE Treena St
- 2553 NE Anna Ave
- 268 NE Treena St
- 2530 NE Anna Ave
- 2552 NE Nova Ave
- 2548 NE Anna Ave
- 2577 NE Anna Ave
- 264 NE Treena St
- 2573 NE Nova Ave
- 2566 NE Anna Ave
- 2523 NE Zander Ct
- 2545 NE Zander Ct
- 2595 NE Anna Ave
- 260 NE Treena St
- 2590 NE Anna Ave
- 2598 NE Nova Ave
- 2551 NE Nova Ave
- 2500 NE Zander Ct
- 2522 NE Zander Ct
- 2616 NE Aurora Dr