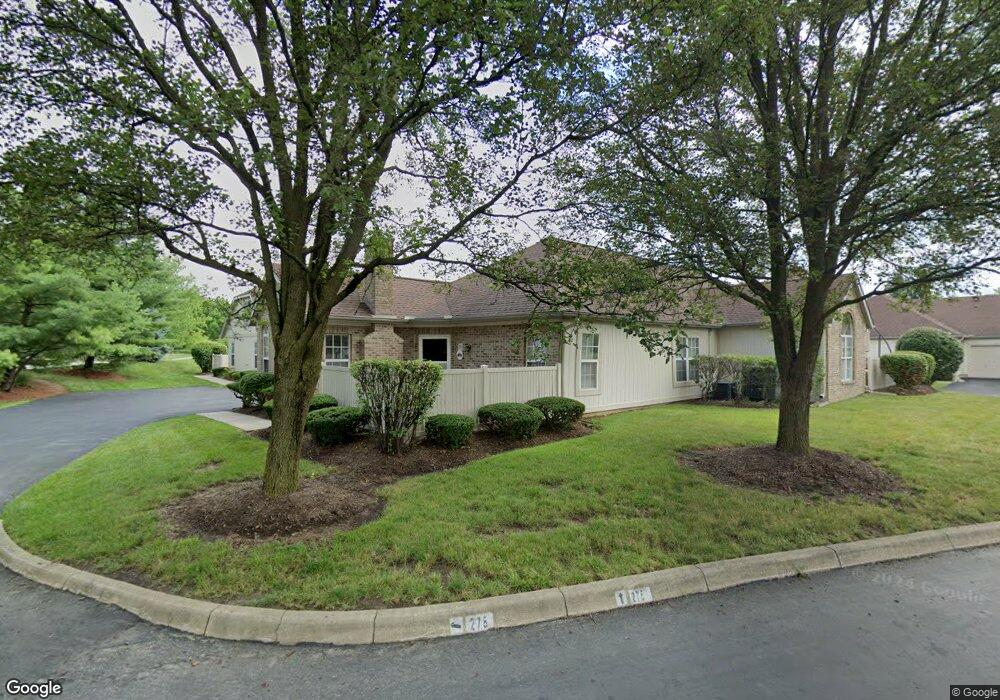
276 Pointe Place Unit TP1D Westerville, OH 43082
Genoa NeighborhoodEstimated Value: $257,000 - $276,000
2
Beds
2
Baths
1,089
Sq Ft
$247/Sq Ft
Est. Value
About This Home
This home is located at 276 Pointe Place Unit TP1D, Westerville, OH 43082 and is currently estimated at $268,831, approximately $246 per square foot. 276 Pointe Place Unit TP1D is a home located in Delaware County with nearby schools including Whittier Elementary School, Genoa Middle School, and Westerville South High School.
Ownership History
Date
Name
Owned For
Owner Type
Purchase Details
Closed on
May 14, 2015
Sold by
Ratliff Thmas L and Ratliff Katherine
Bought by
Ratliff Thmas L and Ratliff Katherine
Current Estimated Value
Home Financials for this Owner
Home Financials are based on the most recent Mortgage that was taken out on this home.
Original Mortgage
$110,800
Interest Rate
3.64%
Mortgage Type
New Conventional
Purchase Details
Closed on
Sep 24, 2012
Sold by
Ratliff Katherine E
Bought by
Ratliff Thomas L
Purchase Details
Closed on
Aug 12, 2008
Sold by
Owen Veronica
Bought by
Ratliff Thomas L and Ratliff Katherine E
Home Financials for this Owner
Home Financials are based on the most recent Mortgage that was taken out on this home.
Original Mortgage
$118,655
Interest Rate
6.54%
Mortgage Type
Purchase Money Mortgage
Purchase Details
Closed on
Mar 1, 2004
Sold by
Williams Leslie L
Bought by
Owen Harold and Owen Veronica
Create a Home Valuation Report for This Property
The Home Valuation Report is an in-depth analysis detailing your home's value as well as a comparison with similar homes in the area
Home Values in the Area
Average Home Value in this Area
Purchase History
| Date | Buyer | Sale Price | Title Company |
|---|---|---|---|
| Ratliff Thmas L | -- | Attornery | |
| Ratliff Thomas L | -- | None Available | |
| Ratliff Thomas L | $41,633 | First American Title | |
| Owen Harold | $123,000 | Chicago Title |
Source: Public Records
Mortgage History
| Date | Status | Borrower | Loan Amount |
|---|---|---|---|
| Closed | Ratliff Thmas L | $110,800 | |
| Closed | Ratliff Thomas L | $118,655 |
Source: Public Records
Tax History Compared to Growth
Tax History
| Year | Tax Paid | Tax Assessment Tax Assessment Total Assessment is a certain percentage of the fair market value that is determined by local assessors to be the total taxable value of land and additions on the property. | Land | Improvement |
|---|---|---|---|---|
| 2024 | $3,262 | $64,020 | $15,050 | $48,970 |
| 2023 | $3,224 | $64,020 | $15,050 | $48,970 |
| 2022 | $3,450 | $52,990 | $10,500 | $42,490 |
| 2021 | $3,479 | $52,990 | $10,500 | $42,490 |
| 2020 | $3,502 | $52,990 | $10,500 | $42,490 |
| 2019 | $3,196 | $46,200 | $10,500 | $35,700 |
| 2018 | $3,142 | $46,200 | $10,500 | $35,700 |
| 2017 | $3,037 | $41,650 | $7,000 | $34,650 |
| 2016 | $3,091 | $41,650 | $7,000 | $34,650 |
| 2015 | $2,957 | $41,650 | $7,000 | $34,650 |
| 2014 | -- | $41,650 | $7,000 | $34,650 |
| 2013 | $2,988 | $41,650 | $7,000 | $34,650 |
Source: Public Records
Map
Nearby Homes
- 267 Windemere Place
- 137 Abbeycross Ln
- 389 Ridgemoor Ln
- 66 Abbeycross Ln
- 92 N Vine St
- 543 N State St
- 199 E College Ave
- 160 N State St
- 364 E College Ave
- 200 Matthew Ave
- 705 N State St Unit 211
- 53 W College Ave
- 518 Kingfisher Dr
- 589 E College Ave
- 417 E Park St
- 79 W Park St
- 385 Hockberry Ave Unit Lot 1603
- 325 Vannette Ln Unit Lot 602
- 317 Vannette Ln Unit Lot 604
- 327 Vannette Ln Unit Lot 601
- 274 Pointe Place Unit TP1C
- 278 Pointe Place
- 280 Pointe Place Unit TP1B
- 275 Pointe Place Unit TP2A
- 288 Pointe Place
- 286 Pointe Place
- 277 Pointe Place
- 273 Pointe Place
- 284 Pointe Place Unit TP3C
- 290 Pointe Place
- 295 Pointe Place
- 297 Pointe Place Unit TP5B
- 298 Pointe Place
- 281 Pointe Place Unit TP4B
- 287 Pointe Place
- 296 Pointe Place
- 355 Amesbury Ct
- 352 Amesbury Ct
- 293 Pointe Place
- 291 Pointe Place