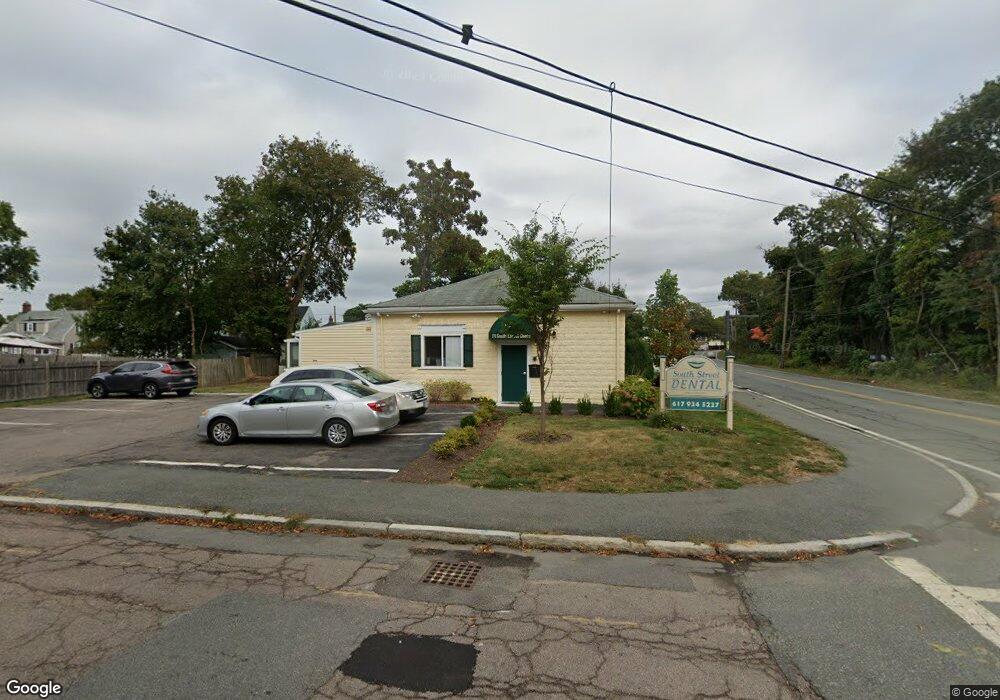
276 South St Quincy, MA 02169
Quincy Point Neighborhood
--
Bed
2
Baths
1,360
Sq Ft
7,405
Sq Ft Lot
About This Home
This home is located at 276 South St, Quincy, MA 02169. 276 South St is a home located in Norfolk County with nearby schools including Point Webster Middle School, Clifford H. Marshall Elementary School, and Quincy High School.
Ownership History
Date
Name
Owned For
Owner Type
Purchase Details
Closed on
Feb 13, 2015
Sold by
Granitr South Street R
Bought by
Ss Realty Llc
Home Financials for this Owner
Home Financials are based on the most recent Mortgage that was taken out on this home.
Original Mortgage
$351,000
Outstanding Balance
$270,222
Interest Rate
3.9%
Mortgage Type
Commercial
Purchase Details
Closed on
Oct 20, 1999
Sold by
Mitchell Virginia E
Bought by
Granite South St Rt
Create a Home Valuation Report for This Property
The Home Valuation Report is an in-depth analysis detailing your home's value as well as a comparison with similar homes in the area
Home Values in the Area
Average Home Value in this Area
Purchase History
| Date | Buyer | Sale Price | Title Company |
|---|---|---|---|
| Ss Realty Llc | $318,000 | -- | |
| Granite South St Rt | $110,000 | -- |
Source: Public Records
Mortgage History
| Date | Status | Borrower | Loan Amount |
|---|---|---|---|
| Open | Ss Realty Llc | $351,000 |
Source: Public Records
Tax History Compared to Growth
Tax History
| Year | Tax Paid | Tax Assessment Tax Assessment Total Assessment is a certain percentage of the fair market value that is determined by local assessors to be the total taxable value of land and additions on the property. | Land | Improvement |
|---|---|---|---|---|
| 2025 | $12,175 | $529,100 | $195,700 | $333,400 |
| 2024 | $11,878 | $529,100 | $183,000 | $346,100 |
| 2023 | $11,735 | $529,100 | $181,200 | $347,900 |
| 2022 | $8,647 | $362,400 | $171,400 | $191,000 |
| 2021 | $9,087 | $375,200 | $169,700 | $205,500 |
| 2020 | $7,708 | $310,300 | $158,200 | $152,100 |
| 2019 | $7,776 | $308,800 | $156,700 | $152,100 |
| 2018 | $8,569 | $316,900 | $164,800 | $152,100 |
| 2017 | $8,576 | $298,700 | $160,100 | $138,600 |
| 2016 | $8,335 | $283,800 | $167,600 | $116,200 |
| 2015 | $8,906 | $294,300 | $173,200 | $121,100 |
| 2014 | $8,988 | $287,800 | $169,500 | $118,300 |
Source: Public Records
Map
Nearby Homes
- 25 5th Ave
- 934 Southern Artery Unit 109
- 51 Sumner St
- 35 Sumner St
- 32 Sumner St
- 16 Perley Place
- 161 Sumner St Unit 4
- 134 S Walnut St
- 41 Broadway
- 200 Falls Blvd Unit C308
- 200 Falls Blvd Unit A105
- 200 Falls Blvd Unit B305
- 72 Main St
- 313 Washington St
- 35 Desmoines Rd Unit 510
- 50 Des Moines Rd Unit E1
- 31 Graham St
- 26 Lawrence St
- 585 Washington St Unit model-2
- 585 Washington St Unit model-1