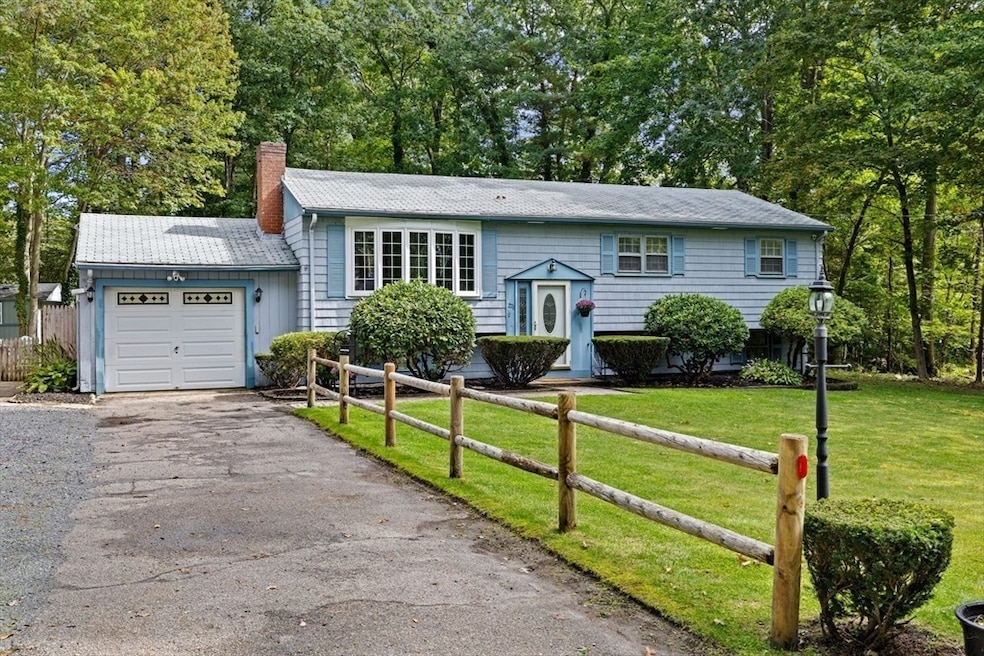
276 Woodland Dr Hanover, MA 02339
Estimated payment $4,018/month
Highlights
- Medical Services
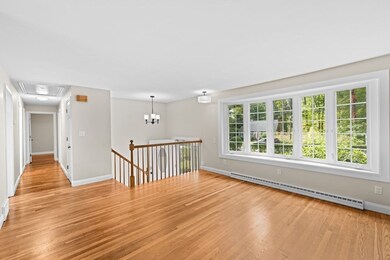
- Open Floorplan
- Property is near public transit
- Hanover High School Rated 9+
- Deck
- Raised Ranch Architecture
About This Home
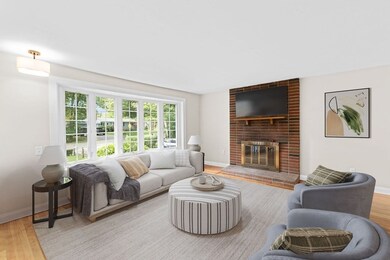
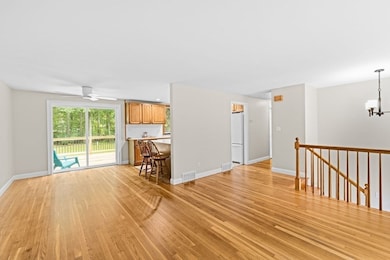
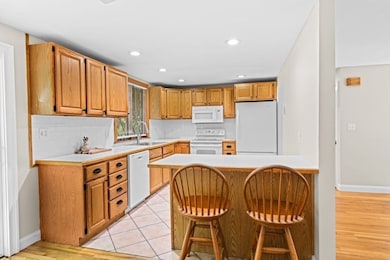
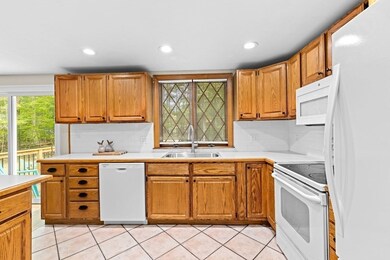
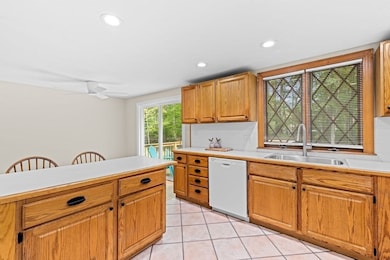
Welcome to 276 Woodland Drive! This well-maintained raised ranch is located in a highly sought-after neighborhood just minutes from Hanover Crossing, Merchants Row & Rte 3 access. Set on a large, level lot, this inviting home offers refinished hardwood floors throughout the main level, fresh interior paint & newer windows and doors. The layout features three comfortable bedrooms & a beautifully renovated full bath. The spacious lower level includes two freshly carpeted bonus rooms—perfect for a home office, playroom, or guest space—as well as a laundry area and a large unfinished basement w/excellent potential for future expansion. Additional highlights include Central-Air, 200 AMP electrical, Generator hookup, NEW septic, 2024 NEW blown-in insulation, a one-car garage & multiple outbuildings ideal for storage, a workshop or creative space. This home offers the perfect blend of comfort, flexibility & location. Don’t miss your chance to make this hidden gem your own! Open SAT & SUN 11-1
Listing Agent
Coldwell Banker Realty - Norwell - Hanover Regional Office Listed on: 09/30/2025

Home Details
Home Type
- Single Family
Est. Annual Taxes
- $6,734
Year Built
- Built in 1961
Lot Details
- 0.69 Acre Lot
- Level Lot
Parking
- 1 Car Attached Garage
- Driveway
- Open Parking
- Off-Street Parking
Home Design
- Raised Ranch Architecture
- Frame Construction
- Shingle Roof
- Concrete Perimeter Foundation
Interior Spaces
- Open Floorplan
- Ceiling Fan
- Recessed Lighting
- Light Fixtures
- Bay Window
- Sliding Doors
- Living Room with Fireplace
- Bonus Room
Kitchen
- Range
- Microwave
- Dishwasher
Flooring
- Wood
- Wall to Wall Carpet
- Laminate
- Marble
- Ceramic Tile
Bedrooms and Bathrooms
- 3 Bedrooms
- Primary Bedroom on Main
- 1 Full Bathroom
- Double Vanity
- Bathtub with Shower
Laundry
- Dryer
- Washer
Finished Basement
- Walk-Out Basement
- Basement Fills Entire Space Under The House
- Interior and Exterior Basement Entry
- Garage Access
- Laundry in Basement
Outdoor Features
- Deck
- Outdoor Storage
- Porch
Location
- Property is near public transit
Schools
- Cedar/Center Elementary School
- Hanover Middle School
- Hanover High School
Utilities
- Forced Air Heating and Cooling System
- 1 Cooling Zone
- Heating System Uses Oil
- Water Heater
- Private Sewer
Listing and Financial Details
- Assessor Parcel Number 1017176
Community Details
Overview
- No Home Owners Association
Amenities
- Medical Services
- Shops
Recreation
- Jogging Path
Map
Home Values in the Area
Average Home Value in this Area
Tax History
| Year | Tax Paid | Tax Assessment Tax Assessment Total Assessment is a certain percentage of the fair market value that is determined by local assessors to be the total taxable value of land and additions on the property. | Land | Improvement |
|---|---|---|---|---|
| 2025 | $6,734 | $545,300 | $269,400 | $275,900 |
| 2024 | $6,751 | $525,800 | $269,400 | $256,400 |
| 2023 | $6,514 | $482,900 | $244,900 | $238,000 |
| 2022 | $6,748 | $442,500 | $244,900 | $197,600 |
| 2021 | $6,627 | $405,800 | $222,600 | $183,200 |
| 2020 | $6,566 | $402,600 | $222,600 | $180,000 |
| 2019 | $10,055 | $377,200 | $222,600 | $154,600 |
| 2018 | $6,089 | $374,000 | $222,600 | $151,400 |
| 2017 | $9,756 | $355,000 | $209,500 | $145,500 |
| 2016 | $5,665 | $336,000 | $190,500 | $145,500 |
| 2015 | $4,981 | $308,400 | $190,500 | $117,900 |
Property History
| Date | Event | Price | List to Sale | Price per Sq Ft |
|---|---|---|---|---|
| 11/02/2025 11/02/25 | Pending | -- | -- | -- |
| 10/23/2025 10/23/25 | Price Changed | $659,000 | -2.9% | $343 / Sq Ft |
| 09/30/2025 09/30/25 | For Sale | $679,000 | -- | $353 / Sq Ft |
Purchase History
| Date | Type | Sale Price | Title Company |
|---|---|---|---|
| Deed | -- | -- |
Source: MLS Property Information Network (MLS PIN)
MLS Number: 73437270
APN: HANO-000011-000000-000061
Disclaimer: Certain information contained herein is derived from information provided by parties other than Homes.com. All information provided is deemed reliable, but is not guaranteed to be accurate and should be independently verified.
![]() The property listing data and information, or the Images, set forth herein were provided to MLS Property Information Network, Inc. from third party sources, including sellers, lessors and public records, and were compiled by MLS Property Information Network, Inc. The property listing data and information, and the Images, are for the personal, non-commercial use of consumers having a good faith interest in purchasing or leasing listed properties of the type displayed to them and may not be used for any purpose other than to identify prospective properties which such consumers may have a good faith interest in purchasing or leasing. MLS Property Information Network, Inc. and its subscribers disclaim any and all representations and warranties as to the accuracy of the property listing data and information, or as to the accuracy of any of the Images, set forth herein.
The property listing data and information, or the Images, set forth herein were provided to MLS Property Information Network, Inc. from third party sources, including sellers, lessors and public records, and were compiled by MLS Property Information Network, Inc. The property listing data and information, and the Images, are for the personal, non-commercial use of consumers having a good faith interest in purchasing or leasing listed properties of the type displayed to them and may not be used for any purpose other than to identify prospective properties which such consumers may have a good faith interest in purchasing or leasing. MLS Property Information Network, Inc. and its subscribers disclaim any and all representations and warranties as to the accuracy of the property listing data and information, or as to the accuracy of any of the Images, set forth herein.
- 53 Chestnut St
- 375 Webster St
- 70 Dillingham Way
- 7 Assinippi Ave Unit 306
- 1239 Main St
- 114 Main St
- 118 Bates Way
- 80 Coolidge Rd
- 62 Larchmont Ln
- 265 Silver St
- 225 Prospect St
- 214 Washington St Unit 24
- 214 Washington St Unit 28
- 348 Main St
- 14 Longwood Ln Unit 14
- 216 Whiting St
- 8 Old Farm Rd
- 107 Wildcat Ln
- 3 Blueberry Ct
- 251 Prospect St