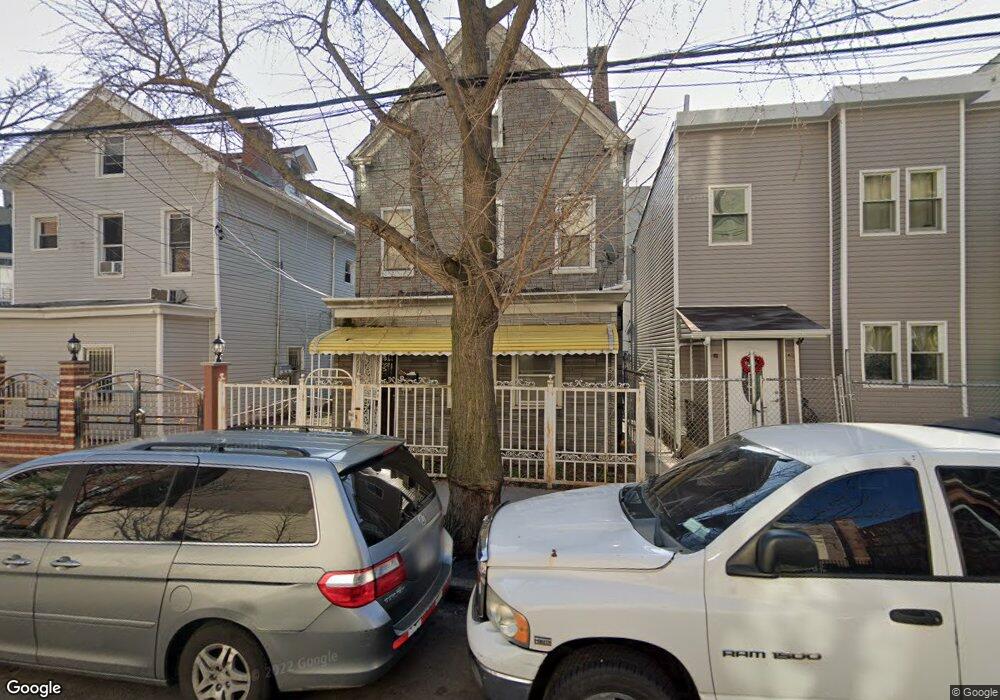
2760 Bainbridge Ave Unit 3 Bronx, NY 10458
Fordham Manor NeighborhoodEstimated Value: $772,000 - $951,000
4
Beds
1
Bath
1,800
Sq Ft
$498/Sq Ft
Est. Value
About This Home
This home is located at 2760 Bainbridge Ave Unit 3, Bronx, NY 10458 and is currently estimated at $896,186, approximately $497 per square foot. 2760 Bainbridge Ave Unit 3 is a home located in Bronx County with nearby schools including P.S. 46 Edgar Allen Poe, I.S. 254X, and Our Lady of Refuge School.
Ownership History
Date
Name
Owned For
Owner Type
Purchase Details
Closed on
Jan 17, 2024
Sold by
Bengar Properties Llc
Bought by
Ofori Charles and Ofori Cheryl
Current Estimated Value
Home Financials for this Owner
Home Financials are based on the most recent Mortgage that was taken out on this home.
Original Mortgage
$816,798
Outstanding Balance
$802,504
Interest Rate
6.95%
Mortgage Type
Purchase Money Mortgage
Estimated Equity
$93,682
Purchase Details
Closed on
Mar 31, 2023
Sold by
Gabriel Executor Juliette
Bought by
Bengar Properties Llc
Purchase Details
Closed on
Jun 10, 1997
Sold by
Hedman Sonia and Moore Inez
Bought by
Moore Inez
Create a Home Valuation Report for This Property
The Home Valuation Report is an in-depth analysis detailing your home's value as well as a comparison with similar homes in the area
Home Values in the Area
Average Home Value in this Area
Purchase History
| Date | Buyer | Sale Price | Title Company |
|---|---|---|---|
| Ofori Charles | $845,000 | -- | |
| Ofori Charles | $845,000 | -- | |
| Bengar Properties Llc | $237,500 | -- | |
| Bengar Properties Llc | $237,500 | -- | |
| Moore Inez | -- | -- | |
| Moore Inez | -- | -- |
Source: Public Records
Mortgage History
| Date | Status | Borrower | Loan Amount |
|---|---|---|---|
| Open | Ofori Charles | $816,798 | |
| Closed | Ofori Charles | $816,798 |
Source: Public Records
Tax History Compared to Growth
Tax History
| Year | Tax Paid | Tax Assessment Tax Assessment Total Assessment is a certain percentage of the fair market value that is determined by local assessors to be the total taxable value of land and additions on the property. | Land | Improvement |
|---|---|---|---|---|
| 2025 | $4,663 | $23,467 | $4,912 | $18,555 |
| 2024 | $4,663 | $23,216 | $5,609 | $17,607 |
| 2023 | $4,453 | $21,924 | $4,556 | $17,368 |
| 2022 | $4,134 | $39,000 | $8,640 | $30,360 |
| 2021 | $4,116 | $31,680 | $8,640 | $23,040 |
| 2020 | $4,139 | $30,360 | $8,640 | $21,720 |
| 2019 | $4,047 | $30,480 | $8,640 | $21,840 |
| 2018 | $3,724 | $18,270 | $5,118 | $13,152 |
| 2017 | $3,518 | $17,256 | $5,673 | $11,583 |
| 2016 | $3,259 | $16,300 | $5,575 | $10,725 |
| 2015 | $337 | $16,297 | $5,859 | $10,438 |
| 2014 | $337 | $16,123 | $6,953 | $9,170 |
Source: Public Records
Map
Nearby Homes
- 2703 Bainbridge Ave
- 2696 Marion Ave
- 2677 Marion Ave
- 2675 Marion Ave
- 2779 Marion Ave
- 2798 Pond Place
- 2670 Marion Ave
- 2830 Briggs Ave Unit WIA
- 2830 Briggs Ave Unit 5B
- 2830 Briggs Ave Unit 4-H
- 2830 Briggs Ave Unit 4F
- 2830 Briggs Ave Unit 3F
- 2830 Briggs Ave Unit 5-C
- 2661 Marion Ave Unit 1H
- 2661 Marion Ave Unit 3C
- 2661 Marion Ave Unit 5A
- 2655 Briggs Ave
- 2640 Marion Ave Unit 4E
- 2640 Marion Ave Unit 6H
- 2856 Briggs Ave
- 2760 Bainbridge Ave
- 2758 Bainbridge Ave
- 2762 Bainbridge Ave
- 2756 Bainbridge Ave
- 310 E 197th St
- 312 E 197th St
- 2766 Bainbridge Ave
- 309 E 197th St
- 303 E 196th St
- 320 E 197th St
- 301 E 196th St
- 315 E 196th St
- 2772 Bainbridge Ave
- 319 E 197th St
- 322 E 197th St
- 322 E 197th St Unit 2
- 317 E 196th St
- 2775 Pond Place
- 2774 Bainbridge Ave
- 2771 Bainbridge Ave