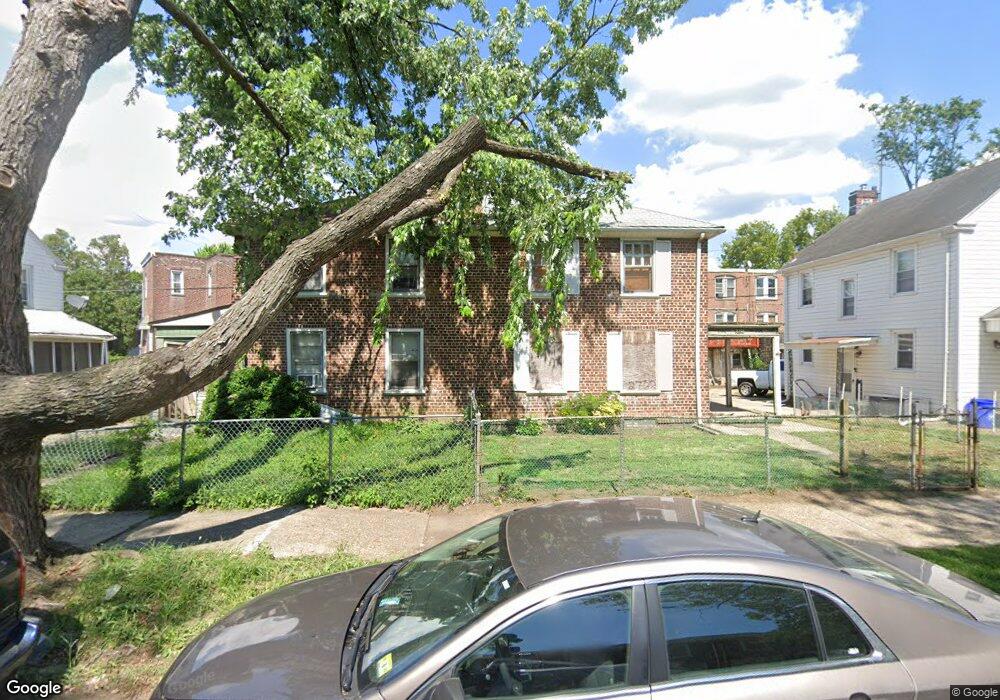
2760 N Constitution Rd Camden, NJ 08104
Fairview NeighborhoodEstimated Value: $142,686 - $196,000
3
Beds
1
Bath
1,160
Sq Ft
$138/Sq Ft
Est. Value
About This Home
This home is located at 2760 N Constitution Rd, Camden, NJ 08104 and is currently estimated at $160,172, approximately $138 per square foot. 2760 N Constitution Rd is a home located in Camden County with nearby schools including Yorkship Elementary School, Camden High School, and Sacred Heart School.
Ownership History
Date
Name
Owned For
Owner Type
Purchase Details
Closed on
Jul 16, 2009
Sold by
National City Bank
Bought by
J And S Hark Realty Investments Llc
Current Estimated Value
Purchase Details
Closed on
Jun 5, 2009
Sold by
Vincent Mensaw L and Vincent Marcelle
Bought by
National City Bank
Purchase Details
Closed on
Sep 27, 2002
Sold by
Rodriguez Jose
Bought by
Vincent Mensaw L and Vincent Marcelle
Home Financials for this Owner
Home Financials are based on the most recent Mortgage that was taken out on this home.
Original Mortgage
$60,521
Interest Rate
6.16%
Mortgage Type
FHA
Purchase Details
Closed on
Oct 23, 1998
Sold by
Ardire Vincent J
Bought by
Rodriguez Jose and Diaz Maria
Home Financials for this Owner
Home Financials are based on the most recent Mortgage that was taken out on this home.
Original Mortgage
$39,264
Interest Rate
6.8%
Mortgage Type
FHA
Create a Home Valuation Report for This Property
The Home Valuation Report is an in-depth analysis detailing your home's value as well as a comparison with similar homes in the area
Home Values in the Area
Average Home Value in this Area
Purchase History
| Date | Buyer | Sale Price | Title Company |
|---|---|---|---|
| J And S Hark Realty Investments Llc | $33,500 | -- | |
| National City Bank | $69,105 | -- | |
| Vincent Mensaw L | $61,000 | -- | |
| Rodriguez Jose | $38,900 | -- |
Source: Public Records
Mortgage History
| Date | Status | Borrower | Loan Amount |
|---|---|---|---|
| Previous Owner | Vincent Mensaw L | $60,521 | |
| Previous Owner | Rodriguez Jose | $39,264 |
Source: Public Records
Tax History Compared to Growth
Tax History
| Year | Tax Paid | Tax Assessment Tax Assessment Total Assessment is a certain percentage of the fair market value that is determined by local assessors to be the total taxable value of land and additions on the property. | Land | Improvement |
|---|---|---|---|---|
| 2025 | $1,842 | $52,000 | $15,200 | $36,800 |
| 2024 | $1,781 | $52,000 | $15,200 | $36,800 |
| 2023 | $1,781 | $52,000 | $15,200 | $36,800 |
| 2022 | $1,748 | $52,000 | $15,200 | $36,800 |
| 2021 | $1,741 | $52,000 | $15,200 | $36,800 |
| 2020 | $1,654 | $52,000 | $15,200 | $36,800 |
| 2019 | $1,583 | $52,000 | $15,200 | $36,800 |
| 2018 | $1,575 | $52,000 | $15,200 | $36,800 |
| 2017 | $1,537 | $52,000 | $15,200 | $36,800 |
| 2016 | $1,488 | $52,000 | $15,200 | $36,800 |
| 2015 | $1,567 | $56,905 | $15,200 | $41,705 |
| 2014 | $1,530 | $56,905 | $15,200 | $41,705 |
Source: Public Records
Map
Nearby Homes
- 2682 N Congress Rd
- 2828 Yorkship Rd Unit 1
- 2845 N Constitution Rd
- 2909 Yorkship Rd
- 2870 Kansas Rd
- 1333 Argus Rd
- 1239 Lakeshore Dr
- 1206 Lakeshore Dr
- 2931 N Constitution Rd
- 2930 N Merrimac Rd
- 1433 N Chesapeake Rd
- 3079 Alabama Rd
- 3069 S Chesapeake Rd
- 2425 Patton St
- 1065 Ironside Rd
- 2407 S 12th St
- 3044 N Merrimac Rd
- 1020 Niagara Rd
- 1029 Ironside Rd
- 1261 S Merrimac Rd
- 2762 N Constitution Rd
- 2752 N Constitution Rd
- 2768 N Constitution Rd
- 2749 N Congress Rd
- 2750 N Constitution Rd
- 2755 N Congress Rd
- 2757 N Congress Rd
- 2751 N Congress Rd
- 2759 N Congress Rd
- 2761 N Congress Rd
- 2774 N Constitution Rd
- 2763 N Congress Rd
- 2757 N Constitution Rd
- 2765 N Congress Rd
- 2759 N Constitution Rd
- 2776 N Constitution Rd
- 2761 N Constitution Rd
- 1463 N Constitution Rd
- 2767 N Congress Rd