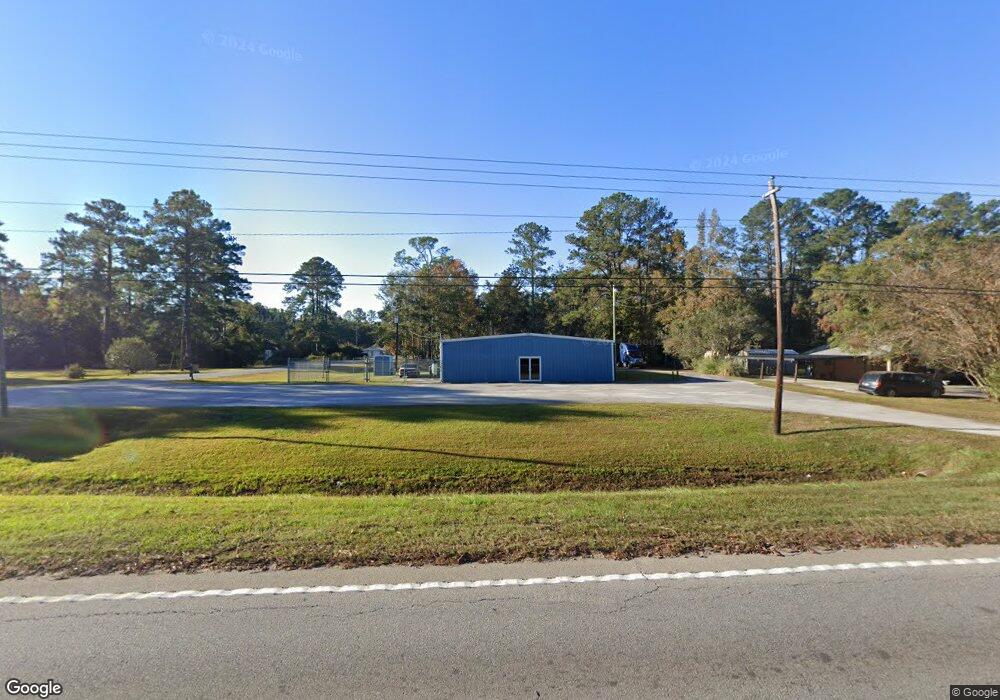
2760 Us Highway 80 Bloomingdale, GA 31302
Estimated Value: $258,402
--
Bed
--
Bath
5,000
Sq Ft
$52/Sq Ft
Est. Value
About This Home
This home is located at 2760 Us Highway 80, Bloomingdale, GA 31302 and is currently estimated at $258,402, approximately $51 per square foot. 2760 Us Highway 80 is a home located in Effingham County with nearby schools including Marlow Elementary School, South Effingham Middle School, and South Effingham High School.
Ownership History
Date
Name
Owned For
Owner Type
Purchase Details
Closed on
Sep 7, 2022
Sold by
Greenleaf Investment Properties Llc
Bought by
Parson David Frank and Parson Heather
Current Estimated Value
Purchase Details
Closed on
Mar 4, 2016
Sold by
M & S Discount Grocery Llc
Bought by
Greenleaf Investment Propertie
Home Financials for this Owner
Home Financials are based on the most recent Mortgage that was taken out on this home.
Original Mortgage
$298,534
Interest Rate
3.72%
Mortgage Type
Commercial
Purchase Details
Closed on
Dec 18, 2015
Sold by
Brazell Michael
Bought by
M & S Discount Grocery Llc
Home Financials for this Owner
Home Financials are based on the most recent Mortgage that was taken out on this home.
Original Mortgage
$50,000
Interest Rate
3.98%
Purchase Details
Closed on
Apr 14, 2005
Sold by
Hagan Delores Brazell
Bought by
Brazell Michael
Create a Home Valuation Report for This Property
The Home Valuation Report is an in-depth analysis detailing your home's value as well as a comparison with similar homes in the area
Home Values in the Area
Average Home Value in this Area
Purchase History
| Date | Buyer | Sale Price | Title Company |
|---|---|---|---|
| Parson David Frank | $221,363 | -- | |
| Greenleaf Investment Propertie | $325,000 | -- | |
| M & S Discount Grocery Llc | -- | -- | |
| Brazell Michael | $60,000 | -- |
Source: Public Records
Mortgage History
| Date | Status | Borrower | Loan Amount |
|---|---|---|---|
| Previous Owner | Greenleaf Investment Propertie | $298,534 | |
| Previous Owner | M & S Discount Grocery Llc | $50,000 |
Source: Public Records
Tax History Compared to Growth
Tax History
| Year | Tax Paid | Tax Assessment Tax Assessment Total Assessment is a certain percentage of the fair market value that is determined by local assessors to be the total taxable value of land and additions on the property. | Land | Improvement |
|---|---|---|---|---|
| 2024 | $3,819 | $101,885 | $48,587 | $53,298 |
| 2023 | $3,727 | $101,885 | $48,587 | $53,298 |
| 2022 | $475 | $84,661 | $30,017 | $54,644 |
| 2021 | $3,005 | $85,564 | $30,017 | $55,547 |
| 2020 | $2,998 | $85,564 | $30,017 | $55,547 |
| 2019 | $3,004 | $85,564 | $30,017 | $55,547 |
| 2018 | $3,041 | $85,564 | $30,017 | $55,547 |
| 2017 | $2,867 | $85,564 | $30,017 | $55,547 |
| 2016 | $1,460 | $40,844 | $15,269 | $25,575 |
| 2015 | -- | $28,185 | $10,179 | $18,006 |
| 2014 | -- | $28,185 | $10,179 | $18,006 |
| 2013 | -- | $28,184 | $10,179 | $18,005 |
Source: Public Records
Map
Nearby Homes
- 2565 Us Highway 80
- 2565 Us Highway 80
- 278 Horseshoe Rd
- 184 Coneflower Rd
- 203 Coneflower Rd
- 202 Coneflower Rd
- 415 Salvia Rd
- 708 Chickadee St
- 148 Pine View Dr
- 138 Bradford Dr
- 2060 Us Highway 80
- 884 Zeigler Rd
- 782 Deerfield Rd E
- 955 Zeigler Rd
- Tract 2 Williams St
- 208 Turpentine Trail
- 109 Chalk Farm Way
- 126 Chalk Farm Way
- 195 Railroad St
- 777 Roebling Rd
- 2744 Us Highway 80
- 111 Arlington Rd
- 2734 Us Highway 80
- 137 Arlington Rd
- 159 Carlton Ave
- 145 Carlton Ave
- 2716 Us Highway 80
- 225 Carlton Ave
- 2795 Us Highway 80
- 156 Arlington Rd
- 192 Carlton Ave
- 133 Carlton Ave
- 2717 Us Highway 80
- 162 Carlton Ave
- 2818 Us Highway 80
- 119 Carlton Ave
- 229 Carlton Ave
- 142 Carlton Ave
- 132 Carlton Ave
- 2741 Us Highway 80