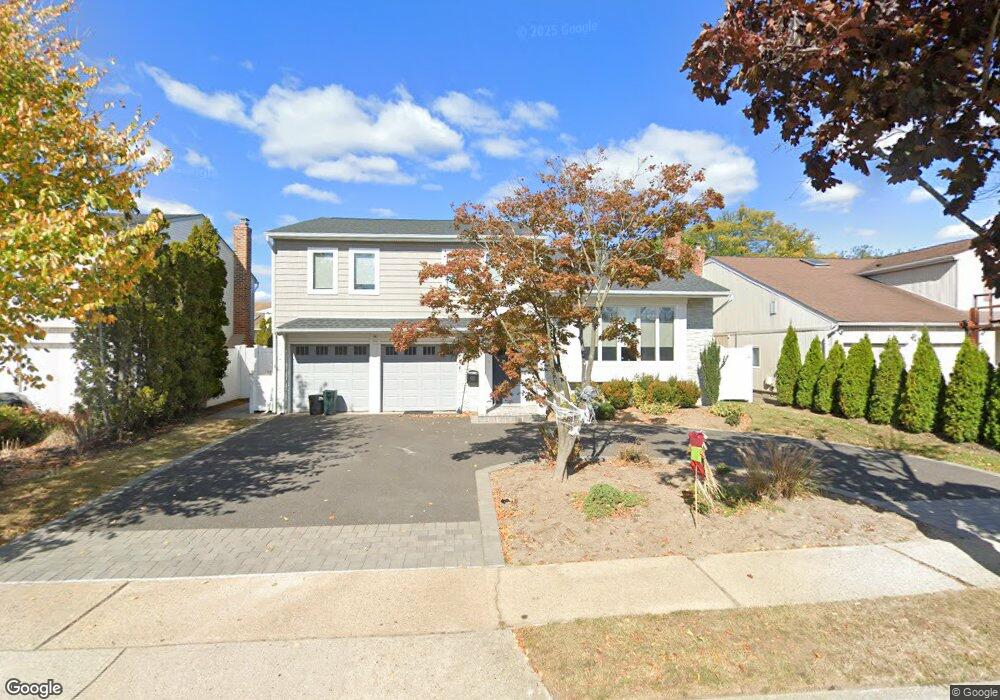
2761 Ellen Rd Bellmore, NY 11710
Estimated Value: $1,176,000
5
Beds
3
Baths
2,850
Sq Ft
$413/Sq Ft
Est. Value
About This Home
This home is located at 2761 Ellen Rd, Bellmore, NY 11710 and is currently estimated at $1,176,000, approximately $412 per square foot. 2761 Ellen Rd is a home located in Nassau County with nearby schools including Winthrop Avenue School, Shore Road School, and Grand Avenue Middle School.
Ownership History
Date
Name
Owned For
Owner Type
Purchase Details
Closed on
Apr 20, 2021
Sold by
2761 Bellmore Llc
Bought by
Lisica Mark Anthony and Lisica Stephanie
Current Estimated Value
Home Financials for this Owner
Home Financials are based on the most recent Mortgage that was taken out on this home.
Original Mortgage
$575,000
Outstanding Balance
$518,872
Interest Rate
3.1%
Mortgage Type
New Conventional
Estimated Equity
$657,128
Purchase Details
Closed on
Jul 16, 2020
Sold by
Silverman Trust
Bought by
2761 Bellmore Llc
Purchase Details
Closed on
Oct 29, 2010
Sold by
Silverman Ira H
Bought by
Silverman Ira H and Ira H Silverman Living Trust
Purchase Details
Closed on
Aug 13, 2008
Sold by
Silverman Ira H and Silverman Susan M
Bought by
Silverman Ira H
Create a Home Valuation Report for This Property
The Home Valuation Report is an in-depth analysis detailing your home's value as well as a comparison with similar homes in the area
Home Values in the Area
Average Home Value in this Area
Purchase History
| Date | Buyer | Sale Price | Title Company |
|---|---|---|---|
| Lisica Mark Anthony | $825,000 | Chicago Title | |
| Lisica Mark Anthony | $825,000 | Chicago Title | |
| Lisica Mark Anthony | $825,000 | None Available | |
| 2761 Bellmore Llc | $475,000 | Westcor Land Title Ins Co | |
| 2761 Bellmore Llc | $475,000 | Westcor Land Title Ins Co | |
| 2761 Bellmore Llc | $475,000 | Westcor Land Title Ins Co | |
| Silverman Ira H | -- | -- | |
| Silverman Ira H | -- | -- | |
| Silverman Ira H | -- | -- | |
| Silverman Ira H | -- | None Available | |
| Silverman Ira H | -- | None Available | |
| Silverman Ira H | -- | None Available |
Source: Public Records
Mortgage History
| Date | Status | Borrower | Loan Amount |
|---|---|---|---|
| Open | Lisica Mark Anthony | $575,000 | |
| Closed | Lisica Mark Anthony | $575,000 |
Source: Public Records
Tax History
| Year | Tax Paid | Tax Assessment Tax Assessment Total Assessment is a certain percentage of the fair market value that is determined by local assessors to be the total taxable value of land and additions on the property. | Land | Improvement |
|---|---|---|---|---|
| 2025 | $18,041 | $594 | $234 | $360 |
| 2024 | $4,370 | $599 | $236 | $363 |
Source: Public Records
Map
Nearby Homes
- 3050 Judith Dr
- 2904 Riverside Dr
- 2929 Mandalay Beach Rd
- 3058 Susan Rd
- 3012 Mandalay Beach Rd
- 3094 Riverside Dr
- 3200 Lydia Ln
- 2988 Lee Place
- 2829 Judith Dr
- 2686 Frances St
- 2631 Rachel St
- 3142 Shore Rd
- 144 Beach Ave
- 6 Island Plaza
- 138 Beach Ave
- 2675 Bellmore Ave
- 116 Beach Ave
- 114 Beach Ave
- 2406 Legion St
- 2876 Shore Rd
- 2767 Ellen Rd
- 2755 Ellen Rd
- 2760 Patricia Ln
- 2754 Patricia Ln
- 2749 Ellen Rd
- 2773 Ellen Rd
- 2766 Patricia Ln
- 2748 Patricia Ln
- 2756 Ellen Rd
- 2762 Ellen Rd
- 2743 Ellen Rd
- 2779 Ellen Rd
- 2750 Ellen Rd
- 2768 Ellen Rd
- 2772 Patricia Ln
- 2742 Patricia Ln
- 2774 Ellen Rd
- 2737 Ellen Rd
- 2780 Ellen Rd
- 2759 Patricia Ln
Your Personal Tour Guide
Ask me questions while you tour the home.