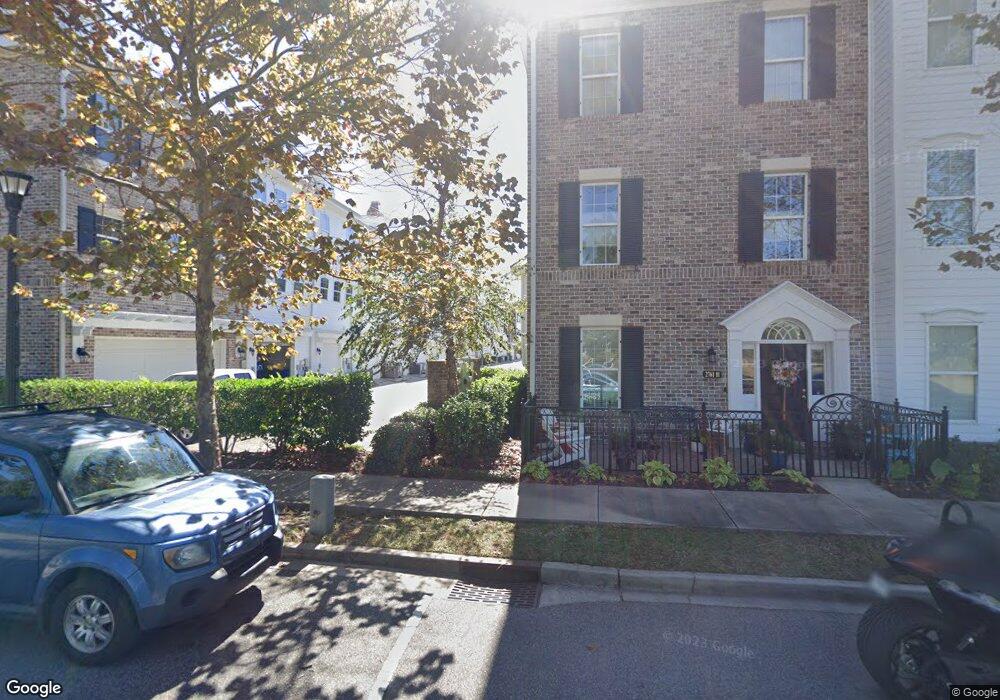
2761 Kruzel St Myrtle Beach, SC 29577
Market Commons NeighborhoodEstimated Value: $472,000 - $496,000
3
Beds
4
Baths
2,190
Sq Ft
$221/Sq Ft
Est. Value
About This Home
This home is located at 2761 Kruzel St, Myrtle Beach, SC 29577 and is currently estimated at $483,267, approximately $220 per square foot. 2761 Kruzel St is a home located in Horry County with nearby schools including Myrtle Beach Child Development Center, Myrtle Beach Primary School, and Myrtle Beach Middle School.
Ownership History
Date
Name
Owned For
Owner Type
Purchase Details
Closed on
Oct 3, 2018
Sold by
Campo Jack
Bought by
Sutton Park Holdings Llc
Current Estimated Value
Home Financials for this Owner
Home Financials are based on the most recent Mortgage that was taken out on this home.
Original Mortgage
$306,403
Outstanding Balance
$264,428
Interest Rate
4.5%
Mortgage Type
New Conventional
Estimated Equity
$218,839
Purchase Details
Closed on
Oct 24, 2017
Sold by
Jones Jonathan L
Bought by
Campo Campo Jack Jack and Campo Ingalill
Home Financials for this Owner
Home Financials are based on the most recent Mortgage that was taken out on this home.
Original Mortgage
$75,000
Interest Rate
3.83%
Mortgage Type
New Conventional
Purchase Details
Closed on
Feb 15, 2008
Sold by
Market Common Townhomes Inc
Bought by
Jones Jonathan L and Brinkosova Stefania
Purchase Details
Closed on
May 16, 2007
Sold by
Luk Mb2 Llc
Bought by
Market Commons Townhomes Inc
Create a Home Valuation Report for This Property
The Home Valuation Report is an in-depth analysis detailing your home's value as well as a comparison with similar homes in the area
Home Values in the Area
Average Home Value in this Area
Purchase History
| Date | Buyer | Sale Price | Title Company |
|---|---|---|---|
| Sutton Park Holdings Llc | $303,500 | -- | |
| Campo Campo Jack Jack | $275,000 | -- | |
| Jones Jonathan L | $324,480 | Attorney | |
| Market Commons Townhomes Inc | $640,000 | None Available |
Source: Public Records
Mortgage History
| Date | Status | Borrower | Loan Amount |
|---|---|---|---|
| Open | Sutton Park Holdings Llc | $306,403 | |
| Previous Owner | Campo Campo Jack Jack | $75,000 |
Source: Public Records
Tax History
| Year | Tax Paid | Tax Assessment Tax Assessment Total Assessment is a certain percentage of the fair market value that is determined by local assessors to be the total taxable value of land and additions on the property. | Land | Improvement |
|---|---|---|---|---|
| 2025 | -- | $0 | $0 | $0 |
| 2024 | -- | $26,780 | $7,500 | $19,280 |
| 2023 | $5,363 | $19,632 | $3,240 | $16,392 |
| 2021 | $5,304 | $19,632 | $3,240 | $16,392 |
| 2020 | $5,059 | $19,632 | $3,240 | $16,392 |
| 2019 | $5,059 | $19,632 | $3,240 | $16,392 |
| 2018 | $0 | $16,170 | $2,400 | $13,770 |
| 2017 | $0 | $9,608 | $1,600 | $8,008 |
| 2016 | -- | $14,412 | $2,400 | $12,012 |
| 2015 | $728 | $14,412 | $2,400 | $12,012 |
| 2014 | $656 | $14,412 | $2,400 | $12,012 |
Source: Public Records
Map
Nearby Homes
- 1441 Peterson St
- 750 Howard Ave Unit E
- 3460 Pampas Dr Unit C
- 2794 Howard Ave Unit A
- 866 Farrow Pkwy
- 812 Moen Place Unit D
- 763 Moen Place Unit 763-B
- 855 Hall Ln Unit D
- 847 Iris St Unit A
- 857 Iris St Unit C
- 3452 Baldwin Ln
- 720 Satterwhite Way
- 3448 Baldwin Ln
- 3385 Pampas Dr
- 824 Shine Ave Unit 29
- 804 Shine Ave
- 945 Rosencrans Ln Unit 945-D
- 764 Shine Ave Unit 764
- 750 Shine Ave Unit 750
- 2790 Cook Cir Unit C
- 2761 Kruzel St Unit C
- 2761 Kruzel St Unit E
- 2761 Kruzel St Unit Market Common
- 2761 Kruzel St Unit 2761-C Kruzel St.
- 2761 Kruzel St Unit Drayton
- 2761 Kruzel St Unit E
- 2761 Kruzel St
- 2761 Kruzel St
- 2761 Kruzel St
- 2761 Kruzel St
- 2761 Kruzel St
- 2761 Kruzel St
- 2761 Kruzel St
- 2761 Kruzel St Unit A
- 2761 Kruzel St Unit A
- 2761B Kruzel St Unit B
- 2761 Kruzel St Unit D
- 2761B Kruzel St Unit Drayton 2
- 2761B Kruzel St
- 2761C Kruzel St Unit 2761C Pinckney Squar
Your Personal Tour Guide
Ask me questions while you tour the home.