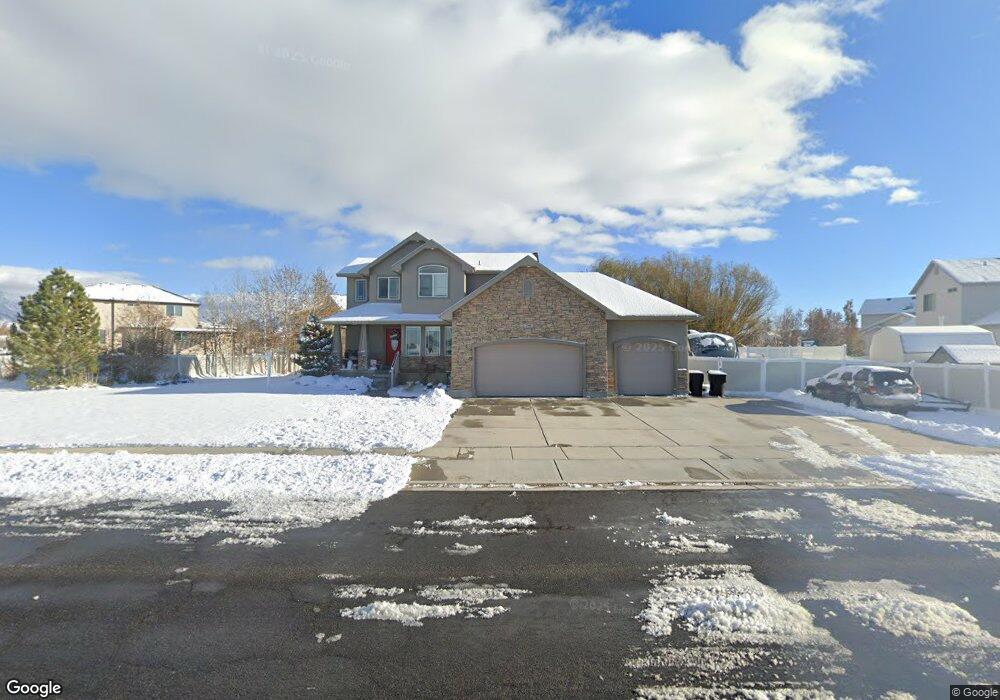
2761 W 2500 N Clearfield, UT 84015
Estimated Value: $576,000 - $603,000
3
Beds
3
Baths
2,970
Sq Ft
$199/Sq Ft
Est. Value
About This Home
This home is located at 2761 W 2500 N, Clearfield, UT 84015 and is currently estimated at $591,080, approximately $199 per square foot. 2761 W 2500 N is a home located in Davis County with nearby schools including West Clinton Elementary School, West Point Junior High School, and Clearfield High School.
Ownership History
Date
Name
Owned For
Owner Type
Purchase Details
Closed on
Jul 21, 2017
Sold by
Neilsen Bruce E and Nielsen Janice
Bought by
Snider Ricahrd and Snider Georgetta
Current Estimated Value
Home Financials for this Owner
Home Financials are based on the most recent Mortgage that was taken out on this home.
Original Mortgage
$279,154
Outstanding Balance
$231,993
Interest Rate
3.9%
Mortgage Type
VA
Estimated Equity
$359,087
Purchase Details
Closed on
Mar 24, 2006
Sold by
Nielsen Bruce E
Bought by
Nielsen Bruce E and Nielsen Janice
Purchase Details
Closed on
Sep 12, 2005
Sold by
Schenck Trevor
Bought by
Nielsen Bruce E
Purchase Details
Closed on
Sep 20, 2004
Sold by
Aspen Homes Development Inc
Bought by
Schenck Trevor
Create a Home Valuation Report for This Property
The Home Valuation Report is an in-depth analysis detailing your home's value as well as a comparison with similar homes in the area
Home Values in the Area
Average Home Value in this Area
Purchase History
| Date | Buyer | Sale Price | Title Company |
|---|---|---|---|
| Snider Ricahrd | -- | First American Title | |
| Nielsen Bruce E | -- | Security Title Of Davis Cnty | |
| Nielsen Bruce E | -- | Security Title | |
| Schenck Trevor | -- | Mountain View Title & Escrow | |
| Aspen Homes Development Inc | -- | Bonneville Title Company Inc |
Source: Public Records
Mortgage History
| Date | Status | Borrower | Loan Amount |
|---|---|---|---|
| Open | Snider Ricahrd | $279,154 |
Source: Public Records
Tax History Compared to Growth
Tax History
| Year | Tax Paid | Tax Assessment Tax Assessment Total Assessment is a certain percentage of the fair market value that is determined by local assessors to be the total taxable value of land and additions on the property. | Land | Improvement |
|---|---|---|---|---|
| 2025 | $3,060 | $294,250 | $116,732 | $177,518 |
| 2024 | $2,919 | $282,150 | $125,271 | $156,879 |
| 2023 | $2,768 | $495,000 | $147,893 | $347,107 |
| 2022 | $2,963 | $293,150 | $84,022 | $209,128 |
| 2021 | $2,657 | $390,000 | $116,227 | $273,773 |
| 2020 | $2,327 | $338,000 | $105,099 | $232,901 |
| 2019 | $2,262 | $321,000 | $111,274 | $209,726 |
| 2018 | $2,102 | $293,000 | $92,566 | $200,434 |
| 2016 | $1,912 | $137,610 | $37,288 | $100,322 |
| 2015 | $1,899 | $129,965 | $37,288 | $92,677 |
| 2014 | $1,810 | $125,817 | $37,288 | $88,529 |
| 2013 | -- | $124,790 | $32,120 | $92,670 |
Source: Public Records
Map
Nearby Homes
- 2592 W 2650 N
- 3027 W 2600 N
- 3033 W 2600 N
- 3186 W 2600 N
- 3068 W 2600 N
- 2571 N 3200 W
- 3028 W 2600 N
- 3016 W 2650 N
- 2322 N 2500 W
- 4276 W 6025 S
- 4164 W 5950 S
- 2434 W 2250 N
- 2617 N 2080 W Unit 176
- Harvard Plan at Summerfield - Enclave
- 2208 W 2615 N
- Linden Plan at Summerfield - Vista
- Yale Plan at Summerfield - Enclave
- Gambel Oak Plan at Summerfield - Vista
- Cedar Plan at Summerfield - Vista
- Elm Plan at Summerfield - Vista