Estimated Value: $154,337 - $200,000
2
Beds
1
Bath
1,428
Sq Ft
$121/Sq Ft
Est. Value
About This Home
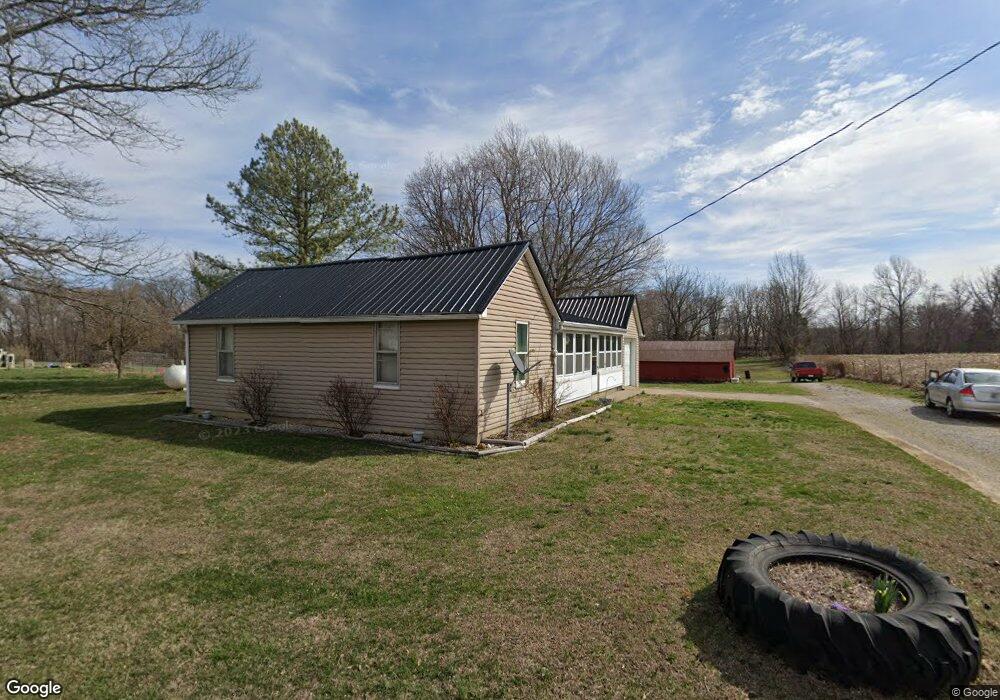
This home is located at 2764 S Wathan Rd, Pekin, IN 47165 and is currently estimated at $172,084, approximately $120 per square foot. 2764 S Wathan Rd is a home located in Washington County with nearby schools including East Washington Elementary School, East Washington Middle School, and Eastern High School.
Ownership History
Date
Name
Owned For
Owner Type
Purchase Details
Closed on
Apr 22, 2024
Sold by
Jackson Brittany Lynn and Mcknight Brittany Lynn
Bought by
Mcknight Travis Shane and Mcknight Brittany Lynn
Current Estimated Value
Home Financials for this Owner
Home Financials are based on the most recent Mortgage that was taken out on this home.
Original Mortgage
$256,000
Outstanding Balance
$252,072
Interest Rate
6.74%
Mortgage Type
New Conventional
Estimated Equity
-$79,988
Purchase Details
Closed on
Jul 24, 2023
Sold by
Mcknight Brittany Lynn
Bought by
Mcknight Travis Shane and Mcknight Prittany Lynn
Purchase Details
Closed on
Apr 12, 2012
Sold by
Goodin Robert and Goodin Michele
Bought by
Jackson Brittany Lynn and Jackson Brittany
Home Financials for this Owner
Home Financials are based on the most recent Mortgage that was taken out on this home.
Original Mortgage
$51,000
Interest Rate
3.9%
Mortgage Type
New Conventional
Create a Home Valuation Report for This Property
The Home Valuation Report is an in-depth analysis detailing your home's value as well as a comparison with similar homes in the area
Home Values in the Area
Average Home Value in this Area
Purchase History
| Date | Buyer | Sale Price | Title Company |
|---|---|---|---|
| Mcknight Travis Shane | -- | None Listed On Document | |
| Mcknight Travis Shane | -- | None Listed On Document | |
| Jackson Brittany Lynn | -- | None Available | |
| Jackson Brittany | -- | None Available |
Source: Public Records
Mortgage History
| Date | Status | Borrower | Loan Amount |
|---|---|---|---|
| Open | Mcknight Travis Shane | $256,000 | |
| Previous Owner | Jackson Brittany Lynn | $51,000 |
Source: Public Records
Tax History Compared to Growth
Tax History
| Year | Tax Paid | Tax Assessment Tax Assessment Total Assessment is a certain percentage of the fair market value that is determined by local assessors to be the total taxable value of land and additions on the property. | Land | Improvement |
|---|---|---|---|---|
| 2024 | $494 | $92,800 | $12,300 | $80,500 |
| 2023 | $664 | $103,100 | $25,000 | $78,100 |
| 2022 | $708 | $97,200 | $25,000 | $72,200 |
| 2021 | $548 | $87,800 | $25,000 | $62,800 |
| 2020 | $519 | $85,300 | $25,000 | $60,300 |
| 2019 | $484 | $83,400 | $25,000 | $58,400 |
| 2018 | $450 | $80,900 | $25,000 | $55,900 |
| 2017 | $388 | $80,600 | $25,000 | $55,600 |
| 2016 | $331 | $75,900 | $25,000 | $50,900 |
| 2014 | $335 | $79,000 | $25,000 | $54,000 |
| 2013 | $311 | $75,100 | $25,000 | $50,100 |
Source: Public Records
Map
Nearby Homes
- 6183 E Motsinger Rd
- 2698 S Mount Zion Church Rd
- 2506 S Mount Zion Church Rd
- 4885 E Farabee Rd
- 4630 E Farabee Rd
- 4616 E Farabee Rd
- 4358 S State Road 60
- 4592 S Old 60
- 10075 E Blue River Rd
- 355 N Naugle Ln
- 11015 Indiana 160
- 3305 E Randy Ln
- 2980 E Banet Rd
- 1204 Old State Road 60 E
- 8091 E New Philadelphia Rd
- E Unit WP001
- 3962 S Fire Lane Rd
- 130 E Eastern Hills Blvd
- 9781 E New Philadelphia Rd
- 0 E Hurst Rd
- 2744 S Wathan Rd
- 2720 S Wathan Rd
- 2715 S Wathan Rd
- 2957 S South Boston Pekin Rd
- 2843 S Wathan Rd
- 2618 S Wathan Rd
- 2590 S Wathan Rd
- 2580 S Wathan Rd
- 2585 S Wathan Rd
- 0 E of Wathan Rd Unit 27308
- 0 E Wathan Rd Unit 201807959
- 0 E of Wathan Rd Unit 201806220
- 0 E of Wathan Rd Unit 201406013
- 0 E Wathan Rd Unit 202305999
- 0 E of Wathan Rd Unit 202207774
- 2497 S Wathan Rd
- 3019 S Wathan Rd
- 2358 S Wathan Rd
- 2513 S South Boston Pekin Rd
- 2521 S South Boston Pekin Rd