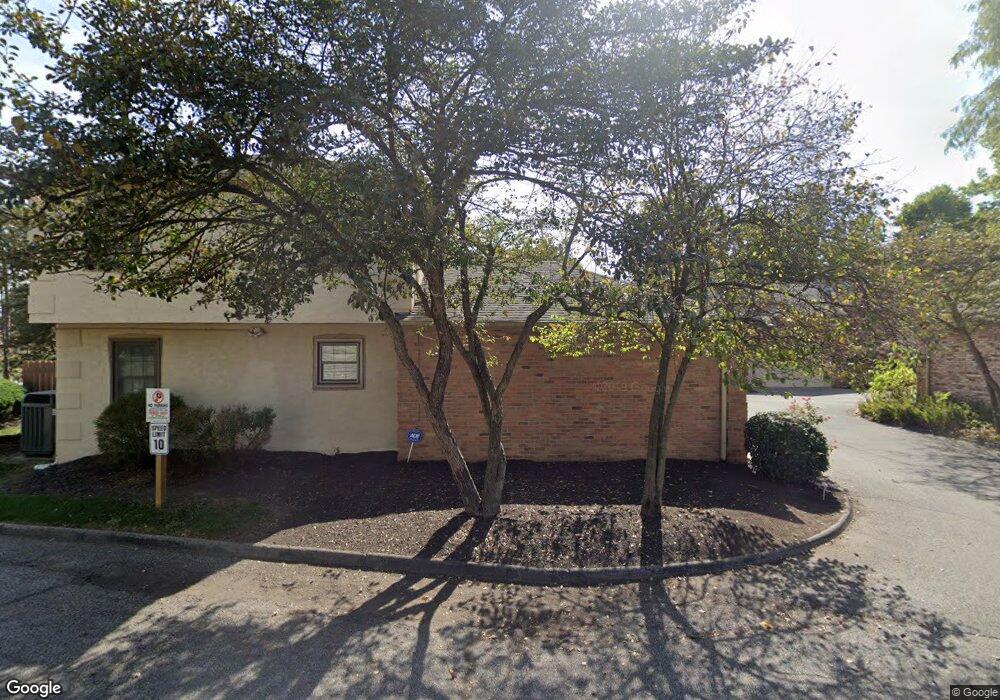
2764 Windridge Dr Unit 2764B Columbus, OH 43231
Northern Woods NeighborhoodEstimated Value: $188,000 - $219,000
3
Beds
2
Baths
1,291
Sq Ft
$156/Sq Ft
Est. Value
About This Home
This home is located at 2764 Windridge Dr Unit 2764B, Columbus, OH 43231 and is currently estimated at $200,788, approximately $155 per square foot. 2764 Windridge Dr Unit 2764B is a home located in Franklin County with nearby schools including Huber Ridge Elementary School, Walnut Springs Middle School, and Westerville Central High School.
Ownership History
Date
Name
Owned For
Owner Type
Purchase Details
Closed on
Aug 20, 2021
Sold by
Forrest Eric
Bought by
Ali Adan Omar
Current Estimated Value
Purchase Details
Closed on
Aug 21, 2009
Sold by
Mccandlish Sarah J
Bought by
Forrest Eric
Home Financials for this Owner
Home Financials are based on the most recent Mortgage that was taken out on this home.
Original Mortgage
$112,917
Interest Rate
5.29%
Mortgage Type
FHA
Purchase Details
Closed on
Sep 26, 2003
Sold by
Amburn David W and Amburn Joan M
Bought by
Mccandlish Sarah J
Home Financials for this Owner
Home Financials are based on the most recent Mortgage that was taken out on this home.
Original Mortgage
$87,900
Interest Rate
6%
Mortgage Type
Purchase Money Mortgage
Purchase Details
Closed on
Feb 26, 1988
Purchase Details
Closed on
Jan 6, 1988
Create a Home Valuation Report for This Property
The Home Valuation Report is an in-depth analysis detailing your home's value as well as a comparison with similar homes in the area
Home Values in the Area
Average Home Value in this Area
Purchase History
| Date | Buyer | Sale Price | Title Company |
|---|---|---|---|
| Ali Adan Omar | $150,100 | Great American Title | |
| Forrest Eric | $115,000 | Talon Group | |
| Mccandlish Sarah J | $109,900 | Chicago Title | |
| -- | -- | -- | |
| -- | -- | -- |
Source: Public Records
Mortgage History
| Date | Status | Borrower | Loan Amount |
|---|---|---|---|
| Previous Owner | Forrest Eric | $112,917 | |
| Previous Owner | Mccandlish Sarah J | $87,900 |
Source: Public Records
Tax History Compared to Growth
Tax History
| Year | Tax Paid | Tax Assessment Tax Assessment Total Assessment is a certain percentage of the fair market value that is determined by local assessors to be the total taxable value of land and additions on the property. | Land | Improvement |
|---|---|---|---|---|
| 2024 | $5,824 | $56,670 | $10,500 | $46,170 |
| 2023 | $2,756 | $56,665 | $10,500 | $46,165 |
| 2022 | $5,194 | $39,270 | $5,460 | $33,810 |
| 2021 | $2,529 | $38,360 | $5,460 | $32,900 |
| 2020 | $2,520 | $38,360 | $5,460 | $32,900 |
| 2019 | $2,037 | $29,510 | $4,200 | $25,310 |
| 2018 | $2,202 | $29,510 | $4,200 | $25,310 |
| 2017 | $2,202 | $29,510 | $4,200 | $25,310 |
| 2016 | $2,459 | $34,060 | $5,220 | $28,840 |
| 2015 | $2,465 | $34,060 | $5,220 | $28,840 |
| 2014 | $2,467 | $34,060 | $5,220 | $28,840 |
| 2013 | $1,293 | $35,840 | $5,495 | $30,345 |
Source: Public Records
Map
Nearby Homes
- 2800 Overview Ct Unit 2800B
- 2677-2679 Blossom Ave
- 5678 Great Hall Ct Unit 12C
- 5841 Forest Hills Blvd Unit 5843
- 2623 Blendon Woods Blvd
- 2727 Patrick Ave
- 3001 Cooper Bluff Dr Unit 3001
- 5600 Cartwright Ln Unit 19
- 2981 Blendon Woods Blvd Unit 983
- 5681 Oliver St
- 3038 Highcliff Ct
- 5670 Oliver St
- 3070 Highcliff Ct Unit 3070
- 3068 Highcliff Ct Unit 3068
- 2721 Woodland Trail Dr Unit 2721
- 3129 Rainier Ave
- 3104 Palomar Ave
- 3066 Ravine Pointe Dr Unit 3066
- 3160 Adirondack Ave
- 3140 Palomar Ave
- 2762 Windridge Dr Unit 2762B
- 2768 Windridge Dr Unit 2768
- 2770 Windridge Dr Unit 2770B
- 2769 Windridge Dr Unit 2769A
- 2761 Windridge Dr Unit 2761
- 2763 Windridge Dr Unit 2763
- 2767 Windridge Dr Unit 2767A
- 2773 Windridge Dr Unit 2773
- 2774 Windridge Dr Unit 2774
- 2775 Windridge Dr Unit 2775
- 2776 Windridge Dr Unit 2776
- 5788-5790 Lou St
- 5788 Lou St Unit 790
- 2779 Windridge Dr Unit 2779
- 5794-5796 Lou St
- 5794 Lou St Unit 796
- 2781 Windridge Dr Unit 2781B
- 2798 Overview Ct Unit 2798B
- 3072 Vista View Blvd
- 3062 Vista View Blvd