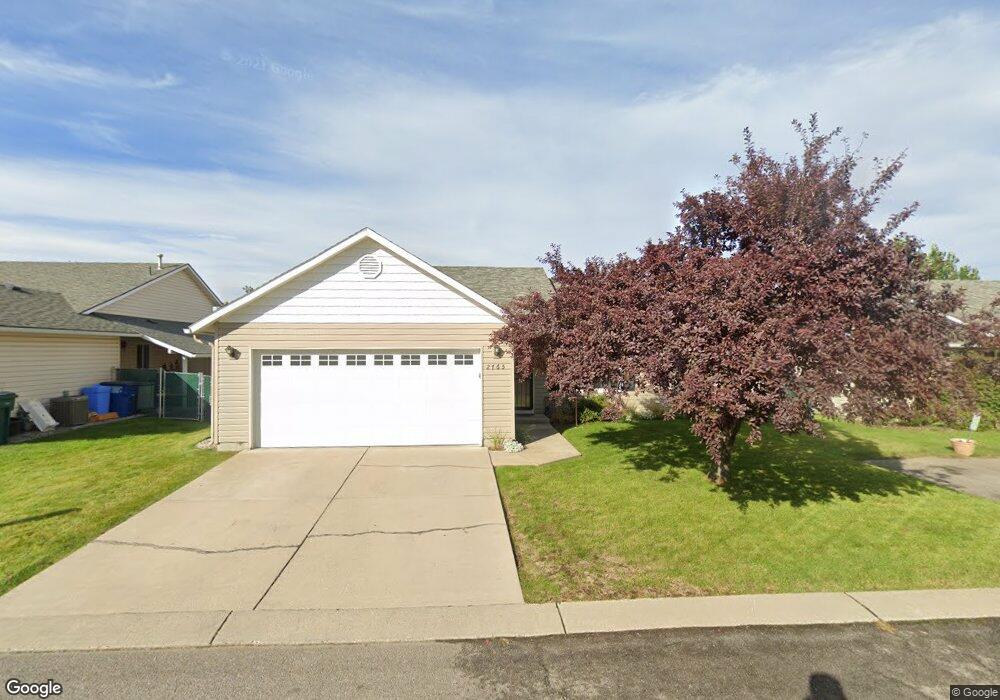
2765 N Wickiup Dr Post Falls, ID 83854
Central Post Falls NeighborhoodEstimated Value: $404,032 - $417,000
3
Beds
2
Baths
1,162
Sq Ft
$352/Sq Ft
Est. Value
About This Home
This home is located at 2765 N Wickiup Dr, Post Falls, ID 83854 and is currently estimated at $409,508, approximately $352 per square foot. 2765 N Wickiup Dr is a home located in Kootenai County with nearby schools including Mullan Trail Elementary School, River City Middle School, and Post Falls High School.
Ownership History
Date
Name
Owned For
Owner Type
Purchase Details
Closed on
Apr 7, 2014
Sold by
Webber Anthony Paul and Webber Debra Kay
Bought by
Keeley Susan E
Current Estimated Value
Home Financials for this Owner
Home Financials are based on the most recent Mortgage that was taken out on this home.
Original Mortgage
$145,000
Outstanding Balance
$109,821
Interest Rate
4.32%
Mortgage Type
VA
Estimated Equity
$299,687
Purchase Details
Closed on
May 25, 2012
Sold by
Martin Billy
Bought by
Webber Anthony Paul and Webber Debra Kay
Purchase Details
Closed on
Aug 24, 2009
Sold by
Webber Anthny P and Webber Debra Kay
Bought by
Webber Anthony Paul and Webber Debra Kay
Purchase Details
Closed on
Sep 19, 2005
Sold by
Swarat David and Swarat Mary
Bought by
Webber Anthony P and Webber Debra
Home Financials for this Owner
Home Financials are based on the most recent Mortgage that was taken out on this home.
Original Mortgage
$27,300
Interest Rate
5.32%
Mortgage Type
Stand Alone Second
Create a Home Valuation Report for This Property
The Home Valuation Report is an in-depth analysis detailing your home's value as well as a comparison with similar homes in the area
Home Values in the Area
Average Home Value in this Area
Purchase History
| Date | Buyer | Sale Price | Title Company |
|---|---|---|---|
| Keeley Susan E | -- | Pioneer Title Kootenai | |
| Webber Anthony Paul | -- | None Available | |
| Webber Anthony Paul | -- | -- | |
| Webber Anthony P | -- | -- |
Source: Public Records
Mortgage History
| Date | Status | Borrower | Loan Amount |
|---|---|---|---|
| Open | Keeley Susan E | $145,000 | |
| Previous Owner | Webber Anthony P | $27,300 | |
| Previous Owner | Webber Anthony P | $145,600 |
Source: Public Records
Tax History
| Year | Tax Paid | Tax Assessment Tax Assessment Total Assessment is a certain percentage of the fair market value that is determined by local assessors to be the total taxable value of land and additions on the property. | Land | Improvement |
|---|---|---|---|---|
| 2025 | $1,355 | $370,610 | $171,000 | $199,610 |
| 2024 | $1,285 | $349,760 | $132,000 | $217,760 |
| 2023 | $1,285 | $376,227 | $165,000 | $211,227 |
| 2022 | $1,795 | $411,069 | $165,000 | $246,069 |
| 2021 | $1,524 | $271,570 | $110,000 | $161,570 |
| 2020 | $1,426 | $220,960 | $80,000 | $140,960 |
| 2019 | $1,289 | $195,910 | $85,000 | $110,910 |
| 2018 | $1,280 | $176,120 | $75,000 | $101,120 |
| 2017 | $1,223 | $153,720 | $55,000 | $98,720 |
| 2016 | $1,177 | $139,600 | $45,000 | $94,600 |
| 2015 | $1,135 | $132,150 | $38,000 | $94,150 |
| 2013 | $2,020 | $113,530 | $29,000 | $84,530 |
Source: Public Records
Map
Nearby Homes
- 2578 N Bradley Ct
- 221 W Frontier Trail
- 2441 N Henry St
- 3351 N Blaze Loop
- 406 W 22nd Ave
- 2815 N Slice Dr
- 500 W 22nd Ave
- 2107 N Walnut St
- 3596 Blaze Loop
- 296 W Tennessee Ave
- 109 W Tennessee Ave
- 3679 N Blaze Loop
- 3636 N Blaze Loop
- 3510 N Blaze Loop
- 3648 N Blaze Loop
- 778 W Jenicek Loop
- 3542 N Blaze Loop
- 2815 N Sand Trap Way
- 561 E Sand Wedge Dr
- 3556 N Blaze Loop
- 2745 N Wickiup Dr
- 2785 N Wickiup Dr
- 2760 N Cochise St
- 2780 N Cochise St
- 2740 N Cochise St
- 2780 N Wickiup Dr
- 2734 Cochise St
- 2760 N Wickiup Dr
- 2815 N Wickiup Dr
- 2820 Cochise St
- 2800 N Wickiup Dr
- 2740 N Wickiup Dr
- 2820 N Cochise St
- 200 W Pawnee Dr
- 220 W Pawnee Dr
- 2820 N Wickiup Dr
- 2745 N Cochise St
- 2517 N Sharon Dr
- 2765 N Cochise St
- 2720 N Wickiup Dr
Your Personal Tour Guide
Ask me questions while you tour the home.