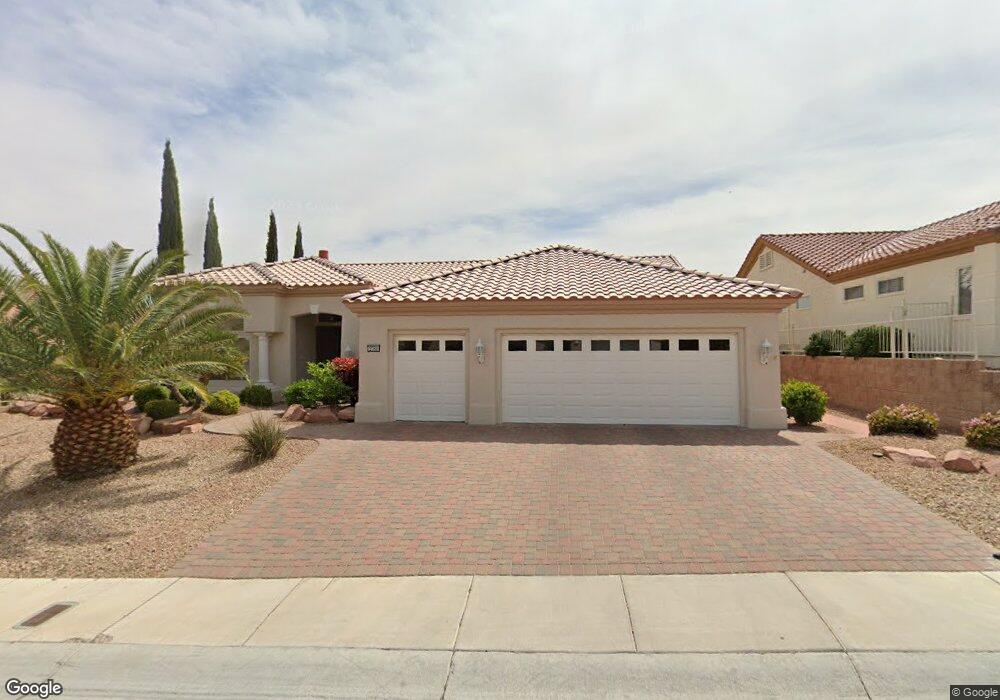
2766 Darby Falls Dr Las Vegas, NV 89134
Sun City Summerlin NeighborhoodEstimated Value: $940,000 - $1,420,000
2
Beds
4
Baths
2,577
Sq Ft
$445/Sq Ft
Est. Value
About This Home
This home is located at 2766 Darby Falls Dr, Las Vegas, NV 89134 and is currently estimated at $1,146,478, approximately $444 per square foot. 2766 Darby Falls Dr is a home located in Clark County with nearby schools including William Lummis Elementary School, Ernest Becker Middle School, and Palo Verde High School.
Ownership History
Date
Name
Owned For
Owner Type
Purchase Details
Closed on
Jun 8, 2009
Sold by
County Of Clark
Bought by
Fitzpatrick Laura B
Current Estimated Value
Purchase Details
Closed on
May 28, 2009
Sold by
Mccormick Julie and Sheehan Ellen
Bought by
Kim Yong Jae and Kim Tae Ja
Purchase Details
Closed on
Nov 8, 2007
Sold by
Mallas Nick
Bought by
Mallas Nick Lance and Mallas Dee
Purchase Details
Closed on
Sep 12, 2005
Sold by
Sheehan Thelma
Bought by
Thelma Sheehan Revocable Living Trust
Purchase Details
Closed on
Jul 23, 2005
Sold by
Sheehan Robert E
Bought by
Mccormick Julie and Sheehan Ellen
Purchase Details
Closed on
Oct 15, 2002
Sold by
Sheehan Robert E
Bought by
Sheehan Robert E and Sheehan Thelma
Purchase Details
Closed on
Nov 26, 1997
Sold by
Sheehan Robert E
Bought by
The Robert E Sheehan Revocable Trust
Purchase Details
Closed on
Mar 8, 1996
Sold by
Del Webb Communities Inc
Bought by
Sheehan Robert E and Sheehan Thelma
Create a Home Valuation Report for This Property
The Home Valuation Report is an in-depth analysis detailing your home's value as well as a comparison with similar homes in the area
Home Values in the Area
Average Home Value in this Area
Purchase History
| Date | Buyer | Sale Price | Title Company |
|---|---|---|---|
| Fitzpatrick Laura B | -- | None Available | |
| Kim Yong Jae | $530,000 | Lawyers Title Of Nevada Cent | |
| Mallas Nick Lance | -- | None Available | |
| Thelma Sheehan Revocable Living Trust | -- | Accommodation | |
| Mccormick Julie | -- | -- | |
| Sheehan Robert E | -- | -- | |
| The Robert E Sheehan Revocable Trust | -- | -- | |
| Sheehan Robert E | $419,000 | First American Title Co |
Source: Public Records
Tax History Compared to Growth
Tax History
| Year | Tax Paid | Tax Assessment Tax Assessment Total Assessment is a certain percentage of the fair market value that is determined by local assessors to be the total taxable value of land and additions on the property. | Land | Improvement |
|---|---|---|---|---|
| 2025 | $5,287 | $210,804 | $98,350 | $112,454 |
| 2024 | $5,287 | $210,804 | $98,350 | $112,454 |
| 2023 | $5,287 | $197,716 | $91,000 | $106,716 |
| 2022 | $5,133 | $176,420 | $78,750 | $97,670 |
| 2021 | $4,983 | $161,053 | $67,725 | $93,328 |
| 2020 | $4,835 | $160,325 | $67,725 | $92,600 |
| 2019 | $4,694 | $151,343 | $59,763 | $91,580 |
| 2018 | $4,558 | $141,581 | $53,025 | $88,556 |
| 2017 | $4,564 | $138,367 | $49,350 | $89,017 |
| 2016 | $4,315 | $134,093 | $42,175 | $91,918 |
| 2015 | $4,307 | $128,000 | $37,275 | $90,725 |
| 2014 | $4,181 | $122,887 | $34,213 | $88,674 |
Source: Public Records
Map
Nearby Homes
- 2739 Darby Falls Dr
- 2736 Darby Falls Dr
- 2755 Faiss Dr
- 10713 Paradise Point Dr
- 2728 Faiss Dr
- 2620 Deer Lake St
- 2621 Breakers Creek Dr
- 2698 Sierra Grande St
- 2913 Darby Falls Dr
- 2675 Sierra Grande St
- 2669 Sierra Grande St
- 2663 Sierra Grande St
- 2657 Sierra Grande St
- 2651 Sierra Grande St
- 2621 Hanging Rock Dr
- 2712 Breakers Creek Dr
- 2616 Faiss Dr
- 2620 Hanging Rock Dr
- 2609 Sierra Sage St
- 2805 Hanging Rock Dr
- 2770 Darby Falls Dr
- 2762 Darby Falls Dr
- 2767 Darby Falls Dr
- 2774 Darby Falls Dr
- 2758 Darby Falls Dr
- 2771 Darby Falls Dr
- 2763 Darby Falls Dr
- 2775 Darby Falls Dr
- 2759 Darby Falls Dr
- 2800 Darby Falls Dr
- 2750 Darby Falls Dr
- 2762 Hartwick Ln
- 2766 Hartwick Ln
- 2755 Darby Falls Dr
- 2770 Hartwick Ln
- 2804 Darby Falls Dr
- 2754 Hartwick Ln
- 2751 Darby Falls Dr
- 2746 Darby Falls Dr