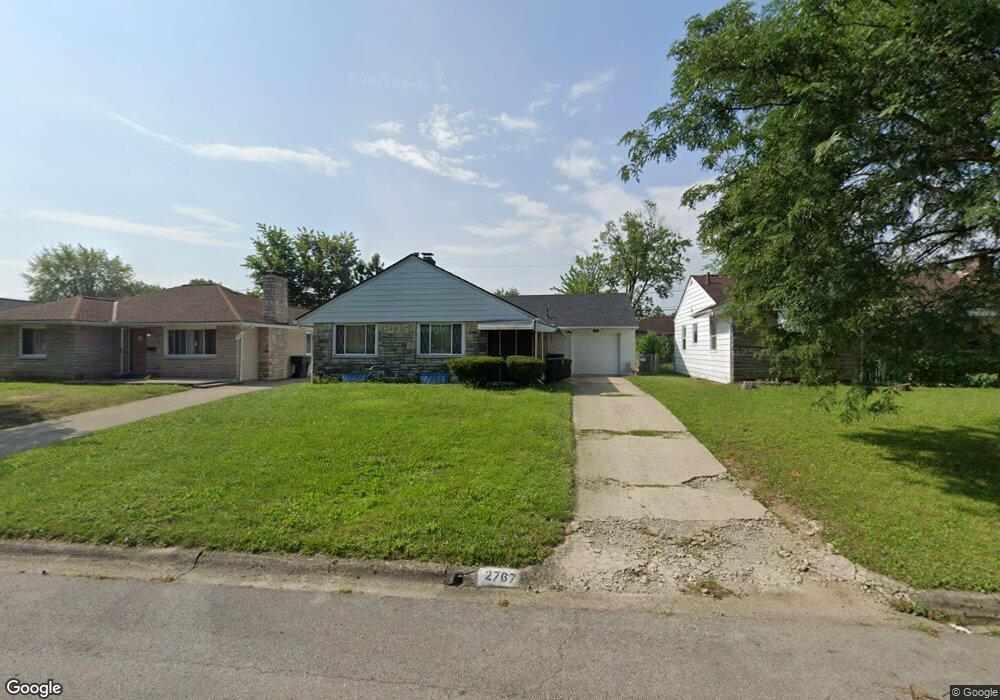
2767 Saint Patrick Rd Columbus, OH 43204
Brookshire NeighborhoodEstimated Value: $202,159 - $224,000
3
Beds
2
Baths
1,262
Sq Ft
$170/Sq Ft
Est. Value
About This Home
This home is located at 2767 Saint Patrick Rd, Columbus, OH 43204 and is currently estimated at $215,040, approximately $170 per square foot. 2767 Saint Patrick Rd is a home located in Franklin County with nearby schools including Lindbergh Elementary School, Hilltonia Middle School, and Briggs High School.
Ownership History
Date
Name
Owned For
Owner Type
Purchase Details
Closed on
May 23, 2024
Sold by
Parham Anthony
Bought by
Parham Melissa
Current Estimated Value
Home Financials for this Owner
Home Financials are based on the most recent Mortgage that was taken out on this home.
Original Mortgage
$135,000
Outstanding Balance
$133,209
Interest Rate
7.17%
Mortgage Type
New Conventional
Estimated Equity
$81,831
Purchase Details
Closed on
May 16, 2024
Sold by
Parham Anthony
Bought by
Parham Melissa
Home Financials for this Owner
Home Financials are based on the most recent Mortgage that was taken out on this home.
Original Mortgage
$135,000
Outstanding Balance
$133,209
Interest Rate
7.17%
Mortgage Type
New Conventional
Estimated Equity
$81,831
Purchase Details
Closed on
Aug 26, 2005
Sold by
Preston Mildred E
Bought by
Parham Anthony and Parham Melissa
Home Financials for this Owner
Home Financials are based on the most recent Mortgage that was taken out on this home.
Original Mortgage
$94,300
Interest Rate
5.82%
Mortgage Type
Stand Alone First
Purchase Details
Closed on
Aug 15, 2003
Sold by
Preston Harvey J and Preston Mildred E
Bought by
Preston Harvey J and Preston Mildred E
Purchase Details
Closed on
Aug 6, 1960
Bought by
Preston Harvey J
Create a Home Valuation Report for This Property
The Home Valuation Report is an in-depth analysis detailing your home's value as well as a comparison with similar homes in the area
Home Values in the Area
Average Home Value in this Area
Purchase History
| Date | Buyer | Sale Price | Title Company |
|---|---|---|---|
| Parham Melissa | -- | Associates Title | |
| Parham Melissa | -- | Associates Title | |
| Parham Anthony | $117,900 | Service Tit | |
| Preston Harvey J | -- | -- | |
| Preston Harvey J | -- | -- |
Source: Public Records
Mortgage History
| Date | Status | Borrower | Loan Amount |
|---|---|---|---|
| Open | Parham Melissa | $135,000 | |
| Closed | Parham Melissa | $135,000 | |
| Previous Owner | Parham Anthony | $94,300 |
Source: Public Records
Tax History Compared to Growth
Tax History
| Year | Tax Paid | Tax Assessment Tax Assessment Total Assessment is a certain percentage of the fair market value that is determined by local assessors to be the total taxable value of land and additions on the property. | Land | Improvement |
|---|---|---|---|---|
| 2024 | $2,678 | $59,680 | $12,500 | $47,180 |
| 2023 | $2,644 | $59,680 | $12,500 | $47,180 |
| 2022 | $2,080 | $40,110 | $5,460 | $34,650 |
| 2021 | $2,084 | $40,110 | $5,460 | $34,650 |
| 2020 | $2,087 | $40,110 | $5,460 | $34,650 |
| 2019 | $2,013 | $33,180 | $4,550 | $28,630 |
| 2018 | $1,782 | $33,180 | $4,550 | $28,630 |
| 2017 | $2,012 | $33,180 | $4,550 | $28,630 |
| 2016 | $1,714 | $25,870 | $4,340 | $21,530 |
| 2015 | $1,556 | $25,870 | $4,340 | $21,530 |
| 2014 | $1,559 | $25,870 | $4,340 | $21,530 |
| 2013 | $905 | $30,450 | $5,110 | $25,340 |
Source: Public Records
Map
Nearby Homes
- 2743 Saint Joseph Ave
- 2743 Bernadette Rd
- 2783-2785 Vanderberg Ave
- 1060 Saint Agnes Ave
- 2687 Vanderberg Ave
- 903 S Harris Ave
- 830 S Harris Ave
- 805 S Warren Ave
- 2610 Spaatz Ave
- 2588 Regina Ave
- 804 S Hague Ave
- 2585 Eakin Rd
- 2579 Eakin Rd
- 898 Chestershire Rd
- 2538 Vanderberg Ave
- 2530 Vanderberg Ave
- 814 Chestershire Rd
- 733 S Hague Ave
- 890 S Roys Ave
- 2929 Briggs Rd
- 2773 Saint Patrick Rd
- 2761 Saint Patrick Rd
- 2753 Saint Patrick Rd
- 2780 Saint Joseph Ave
- 2783 Saint Patrick Rd
- 2762 Saint Joseph Ave
- 2762 St Joseph Ave
- 964 S Warren Ave
- 2747 Saint Patrick Rd
- 2760 Saint Patrick Rd
- 2768 Saint Patrick Rd
- 2752 Saint Patrick Rd
- 2756 Saint Joseph Ave
- 2786 Saint Joseph Ave
- 2778 Saint Patrick Rd
- 2741 Saint Patrick Rd
- 2748 Saint Joseph Ave
- 2740 Saint Patrick Rd
- 2735 Saint Patrick Rd
- 926 S Warren Ave