T
Landlord's Agent in 2025
Tracey Chen
Open House Atlanta Property Management
(404) 493-0861
2 Total Sales
Estimated Value: $322,000 - $344,804
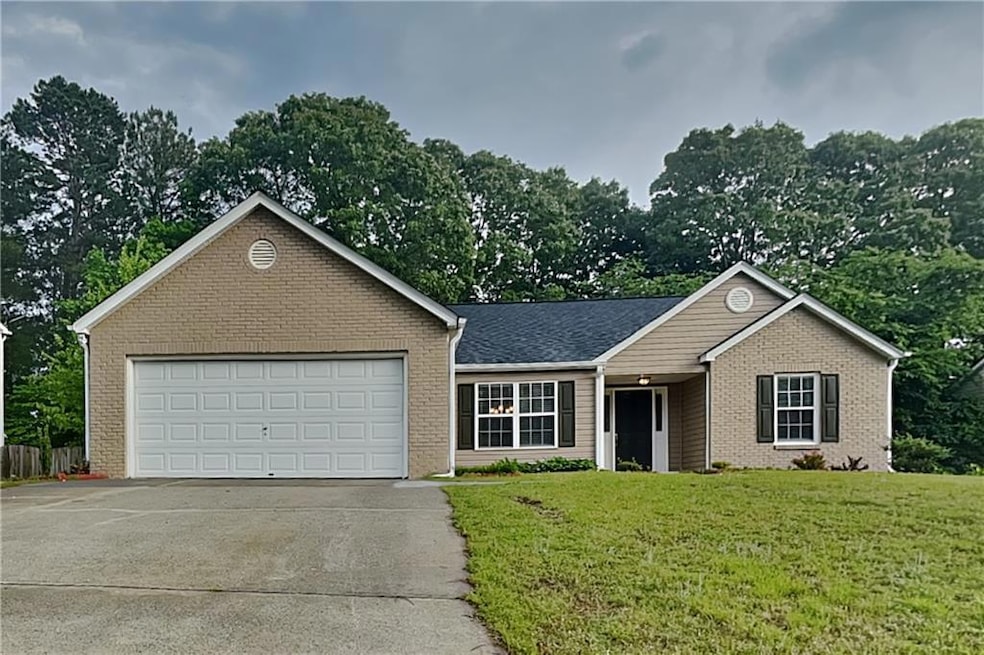
Charming 3 beds, 2 baths, 1,834 sqft home in Dacula! Open kitchen concept with updated counters and a spacious living room. Primary suite with attached bathroom. Spacious backyard, great for gatherings! Pets accepted on a case by case basis. Additional admin fees apply. The Fireplace is decorative. Schedule your showing today! This home is as-is.
This home may be located within a Homeowners Association (HOA) community. If so, residents will be responsible for adhering to all HOA rules and regulations. Please contact your agent or landlord's agent for more information.
Last Agent to Rent the Property
Open House Atlanta Property Management License #232038 Listed on: 04/27/2025
| Date | Buyer | Sale Price | Title Company |
|---|---|---|---|
| Open House Atlanta Realty & Investments | $321,500 | -- | |
| Sigman Robert M | $151,000 | -- | |
| Keyes Joe B | -- | -- | |
| Keyes Joe B | $147,000 | -- | |
| Borner Max R | $118,400 | -- |
| Date | Status | Borrower | Loan Amount |
|---|---|---|---|
| Previous Owner | Sigman Robert M | $148,265 | |
| Previous Owner | Keyes Joe B | $144,728 | |
| Previous Owner | Borner Max R | $112,400 |
| Date | Event | Price | List to Sale | Price per Sq Ft |
|---|---|---|---|---|
| 07/09/2025 07/09/25 | Rented | $2,045 | 0.0% | -- |
| 06/29/2025 06/29/25 | Under Contract | -- | -- | -- |
| 06/16/2025 06/16/25 | Price Changed | $2,045 | -2.4% | $1 / Sq Ft |
| 06/08/2025 06/08/25 | Price Changed | $2,095 | -2.3% | $1 / Sq Ft |
| 06/02/2025 06/02/25 | Price Changed | $2,145 | -2.5% | $1 / Sq Ft |
| 04/27/2025 04/27/25 | For Rent | $2,200 | -- | -- |
| Year | Tax Paid | Tax Assessment Tax Assessment Total Assessment is a certain percentage of the fair market value that is determined by local assessors to be the total taxable value of land and additions on the property. | Land | Improvement |
|---|---|---|---|---|
| 2025 | $3,606 | $134,680 | $30,000 | $104,680 |
| 2024 | $3,582 | $127,480 | $31,200 | $96,280 |
| 2023 | $3,582 | $130,000 | $31,200 | $98,800 |
| 2022 | $3,310 | $116,240 | $26,000 | $90,240 |
| 2021 | $2,752 | $87,440 | $21,200 | $66,240 |
| 2020 | $2,596 | $79,320 | $18,400 | $60,920 |
| 2019 | $2,531 | $79,320 | $18,400 | $60,920 |
| 2018 | $2,365 | $71,680 | $14,800 | $56,880 |
| 2016 | $2,143 | $60,440 | $12,800 | $47,640 |
| 2015 | $2,070 | $56,320 | $11,200 | $45,120 |
| 2014 | $2,079 | $56,320 | $11,200 | $45,120 |
T
Landlord's Agent in 2025
Tracey Chen
Open House Atlanta Property Management
(404) 493-0861
2 Total Sales

Tenant's Agent in 2025
Lenka Wilkinson
NOT A VALID MEMBER
(479) 739-4136
6 Total Sales
Source: First Multiple Listing Service (FMLS)
MLS Number: 7568615
APN: 2-001E-254
Disclaimer: Certain information contained herein is derived from information provided by parties other than Homes.com. All information provided is deemed reliable, but is not guaranteed to be accurate and should be independently verified.
![]() Listings identified with the FMLS IDX logo come from FMLS and are held by brokerage firms other than the owner of this website. The listing brokerage is identified in any listing details. Information is deemed reliable but is not guaranteed. If you believe any FMLS listing contains material that infringes your copyrighted work please visit www.fmls.com/dmca to review our DMCA policy and learn how to submit a takedown request. © 2025 First Multiple Listing Service, Inc.
Listings identified with the FMLS IDX logo come from FMLS and are held by brokerage firms other than the owner of this website. The listing brokerage is identified in any listing details. Information is deemed reliable but is not guaranteed. If you believe any FMLS listing contains material that infringes your copyrighted work please visit www.fmls.com/dmca to review our DMCA policy and learn how to submit a takedown request. © 2025 First Multiple Listing Service, Inc.