
Landlord's Agent in 2024
Marina Csernits
Brookstone, Realtors LLC
(248) 655-0200
6 in this area
32 Total Sales
Estimated Value: $475,333 - $537,000
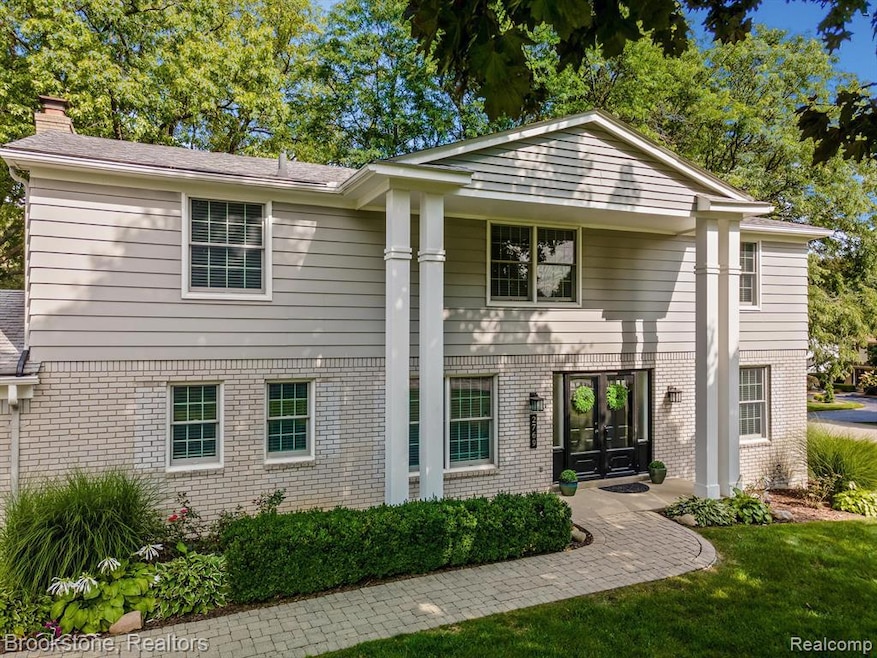
Pristine Bloomfield home for lease! Beautifully updated. Gorgeous kitchen w/ stone counters, stainless appliances, gas stove, tile backsplash. Formal dining area, living room, family room with fireplace and private den/office space with french doors. Beautiful lighting. Harwood floors throughout. Main floor laundry room. FIVE LARGE bedrooms. Primary suite with recessed lights, stunning primary bath, walk in closet. Partially finished lower level with tons of additional storage. Long term lease preferred. Perfectly situated with easy access to Woodward and Expressways. Bloomfield Hills Schools. Close Proximity to St. Hugo, International Academy and Cranbrook.
Last Agent to Rent the Property
Brookstone, Realtors LLC License #6501380784 Listed on: 09/20/2024
| Date | Buyer | Sale Price | Title Company |
|---|---|---|---|
| The Home Capital Llc | $295,000 | None Available | |
| Keenan Lynn R | -- | None Available |
| Date | Event | Price | List to Sale | Price per Sq Ft | Prior Sale |
|---|---|---|---|---|---|
| 10/01/2024 10/01/24 | Rented | $4,300 | 0.0% | -- | |
| 10/01/2024 10/01/24 | Under Contract | -- | -- | -- | |
| 09/20/2024 09/20/24 | For Rent | $4,300 | +1.2% | -- | |
| 08/20/2021 08/20/21 | Rented | $4,250 | +5.6% | -- | |
| 08/20/2021 08/20/21 | Under Contract | -- | -- | -- | |
| 12/10/2018 12/10/18 | Rented | $4,025 | +1.9% | -- | |
| 11/30/2018 11/30/18 | Under Contract | -- | -- | -- | |
| 10/24/2018 10/24/18 | For Rent | $3,950 | 0.0% | -- | |
| 10/24/2018 10/24/18 | Under Contract | -- | -- | -- | |
| 10/18/2018 10/18/18 | For Rent | $3,950 | 0.0% | -- | |
| 05/25/2018 05/25/18 | Sold | $295,000 | +13.9% | $118 / Sq Ft | View Prior Sale |
| 05/04/2018 05/04/18 | Pending | -- | -- | -- | |
| 05/01/2018 05/01/18 | For Sale | $259,000 | -- | $103 / Sq Ft |
| Year | Tax Paid | Tax Assessment Tax Assessment Total Assessment is a certain percentage of the fair market value that is determined by local assessors to be the total taxable value of land and additions on the property. | Land | Improvement |
|---|---|---|---|---|
| 2024 | $4,461 | $194,460 | $0 | $0 |
| 2023 | $4,255 | $167,860 | $0 | $0 |
| 2022 | $8,296 | $166,340 | $0 | $0 |
| 2021 | $9,142 | $182,240 | $0 | $0 |
| 2020 | $4,576 | $193,290 | $0 | $0 |
| 2019 | $8,892 | $182,770 | $0 | $0 |
| 2018 | $4,981 | $177,210 | $0 | $0 |
| 2017 | $4,946 | $174,410 | $0 | $0 |
| 2016 | $4,955 | $165,620 | $0 | $0 |
| 2015 | -- | $144,970 | $0 | $0 |
| 2014 | -- | $134,360 | $0 | $0 |
| 2011 | -- | $122,760 | $0 | $0 |
Landlord's Agent in 2024
Marina Csernits
Brookstone, Realtors LLC
(248) 655-0200
6 in this area
32 Total Sales
Tenant's Agent in 2024
Darby Kolano
The Charles Reinhart Company
(734) 368-2304
101 Total Sales
M
Seller's Agent in 2018
M. Michael Cotter
Max Broock, REALTORS®-Birmingham
P
Seller Co-Listing Agent in 2018
Paula Law
Max Broock, REALTORS®-Birmingham
Buyer's Agent in 2018
Karen Weston Hall
Brookstone, Realtors LLC
(248) 980-6823
2 in this area
18 Total Sales
Source: Realcomp
MLS Number: 20240071114
APN: 19-10-277-001
Disclaimer: Certain information contained herein is derived from information provided by parties other than Homes.com. All information provided is deemed reliable, but is not guaranteed to be accurate and should be independently verified.
![]() IDX provided courtesy of Realcomp II Ltd. via Ten-X and MLS
IDX provided courtesy of Realcomp II Ltd. via Ten-X and MLS
Copyright 2025 Realcomp II Ltd. Shareholders
IDX information is provided exclusively for consumers' personal, noncommercial use and may not be used for any purpose other than to identify prospective properties consumers may be interested in purchasing. The accuracy of all information, regardless of source, is not guaranteed or warranted. All information should be independently verified.
Listing Information presented by local MLS brokerage: Ten-X, local REALTOR®- Arlene Richardson - (888)-952-6393